Free Access
Fig. 8
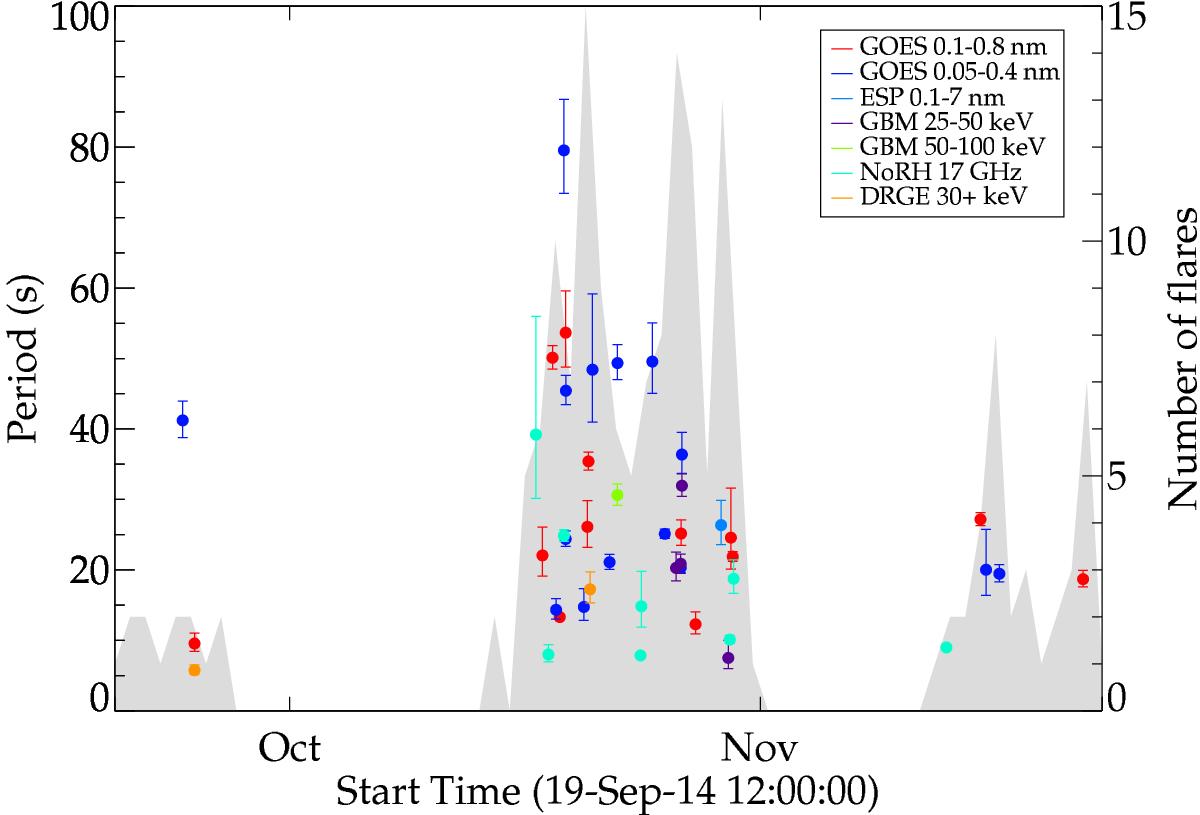
QPP periods plotted against the approximate time at which the QPP signal begins. There is no obvious trend suggesting that there is no characteristic timescale evolving with time. The grey shaded region indicates the number of flares that occurred on a particular day.
Current usage metrics show cumulative count of Article Views (full-text article views including HTML views, PDF and ePub downloads, according to the available data) and Abstracts Views on Vision4Press platform.
Data correspond to usage on the plateform after 2015. The current usage metrics is available 48-96 hours after online publication and is updated daily on week days.
Initial download of the metrics may take a while.