Fig. 3
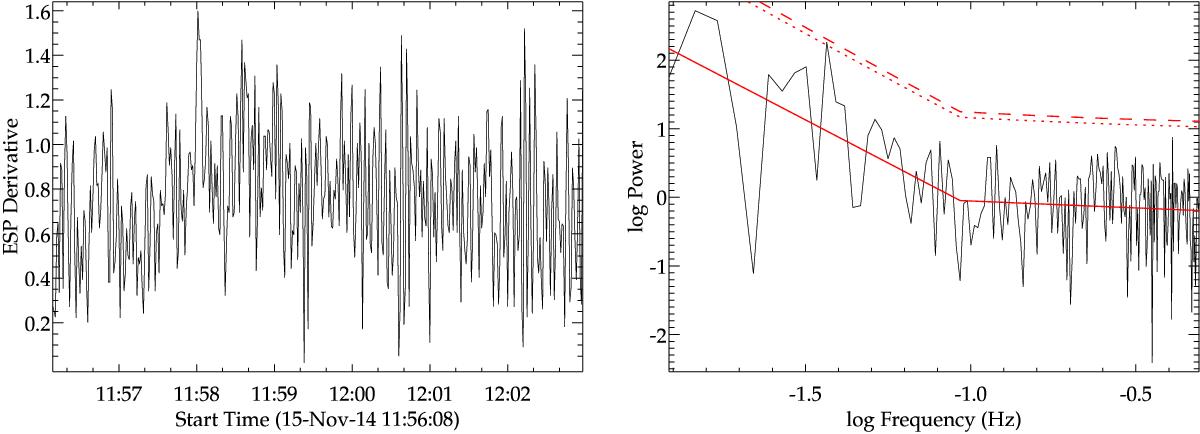
Left: time derivative of a section of flare 152 observed by EVE/ESP. Right: the corresponding power spectrum, where the red solid line is a broken power law fit to the spectrum, the red dotted line represents the 95% confidence level, and the red dashed line the 99% level. One peak is above the 95% level, at a period of 27.3 ± 0.9 s.
Current usage metrics show cumulative count of Article Views (full-text article views including HTML views, PDF and ePub downloads, according to the available data) and Abstracts Views on Vision4Press platform.
Data correspond to usage on the plateform after 2015. The current usage metrics is available 48-96 hours after online publication and is updated daily on week days.
Initial download of the metrics may take a while.