Free Access
Fig. 1
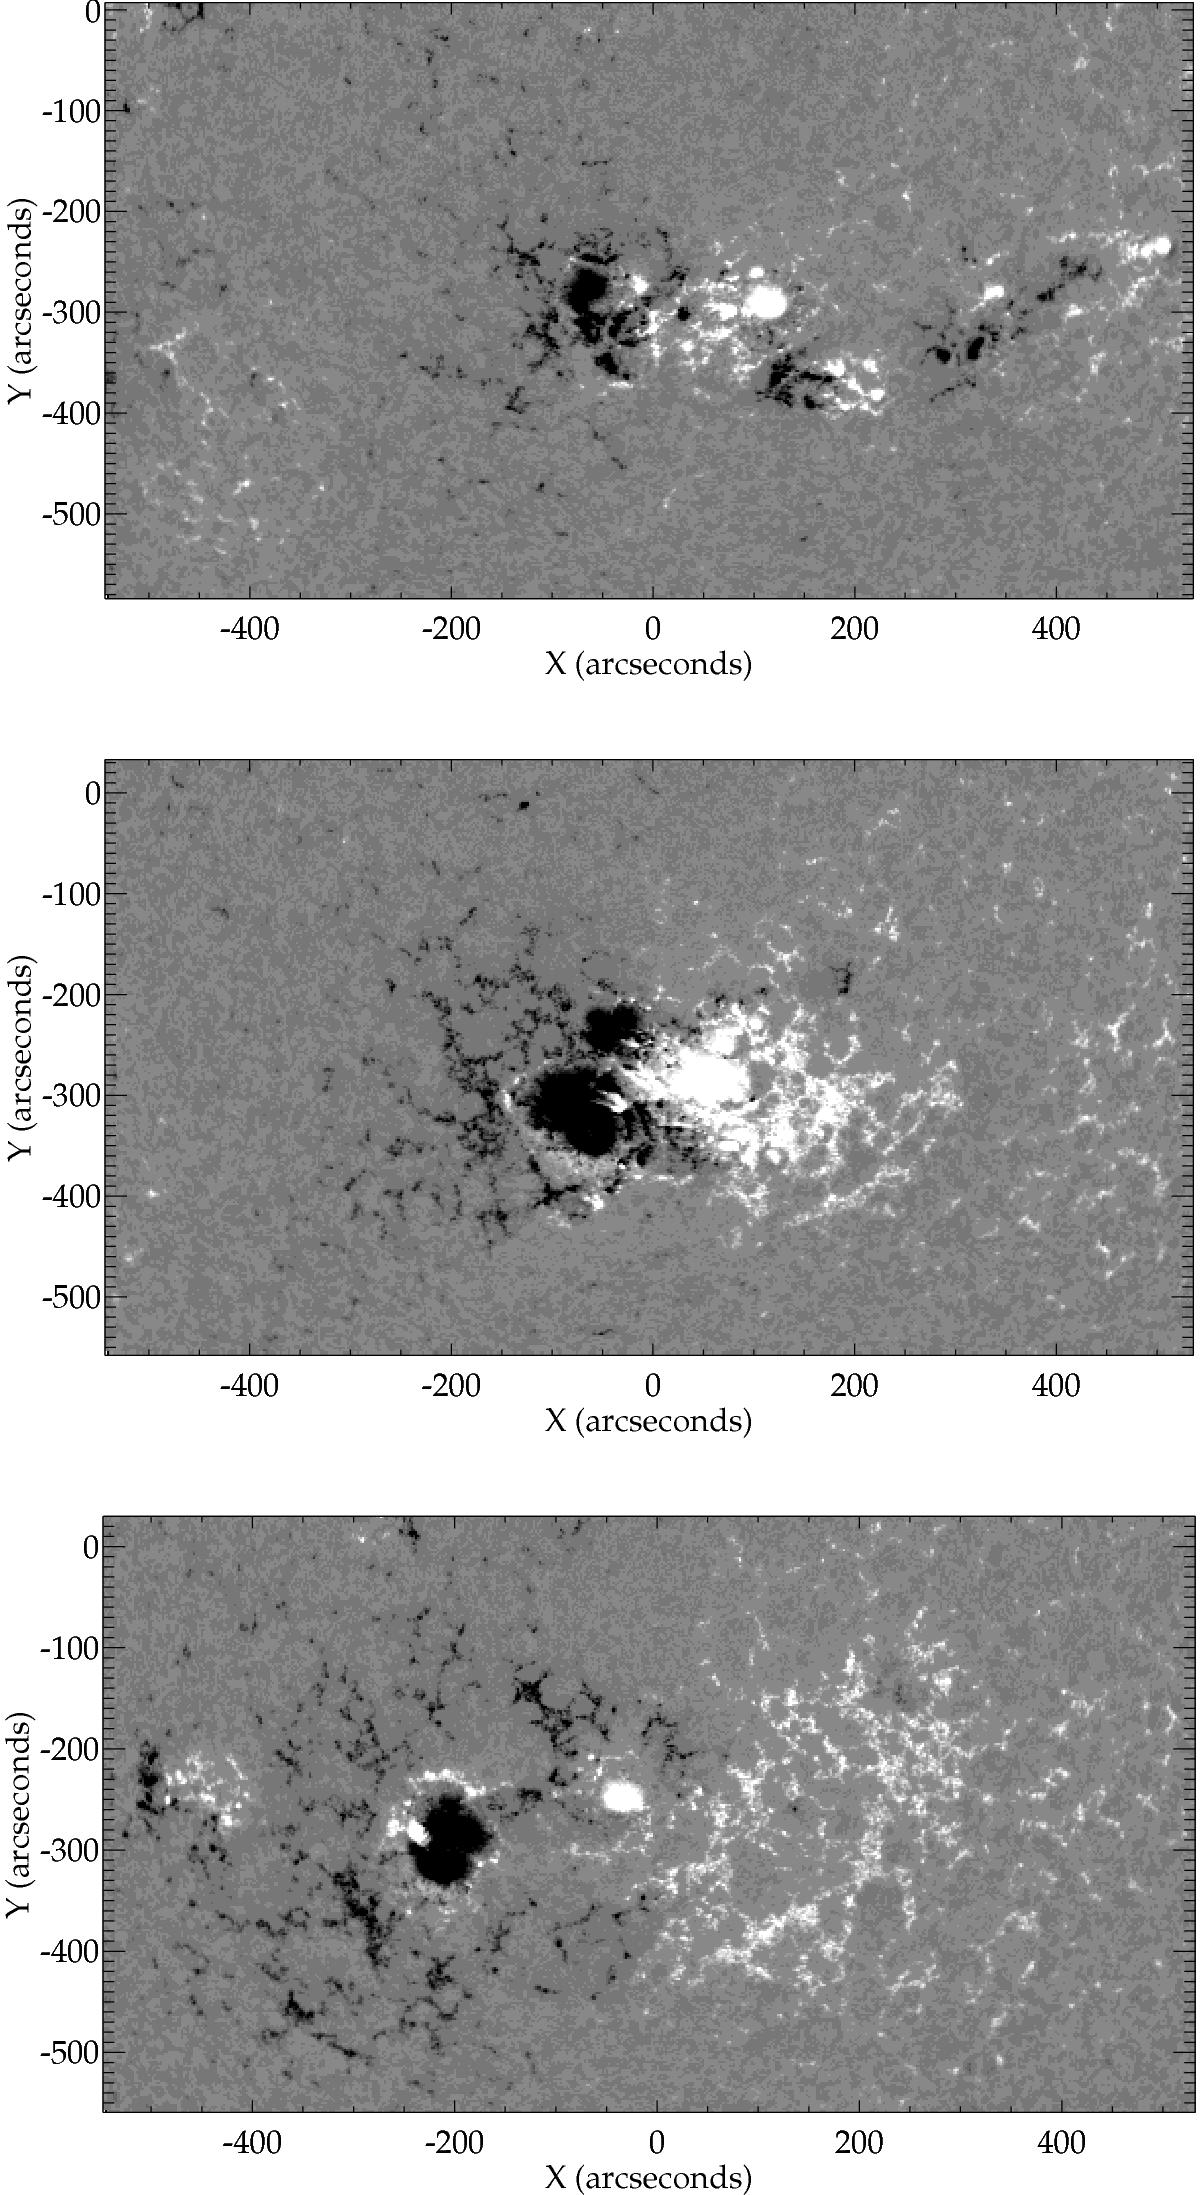
Magnetogram images of the active region from HMI, taken during its three crossings of the solar disk: at 2014 September 26 22:01:30 (top), 2014 October 23 15:01:30 (middle), and 2014 November 19 07:01:30 (bottom).
Current usage metrics show cumulative count of Article Views (full-text article views including HTML views, PDF and ePub downloads, according to the available data) and Abstracts Views on Vision4Press platform.
Data correspond to usage on the plateform after 2015. The current usage metrics is available 48-96 hours after online publication and is updated daily on week days.
Initial download of the metrics may take a while.