Fig. 2
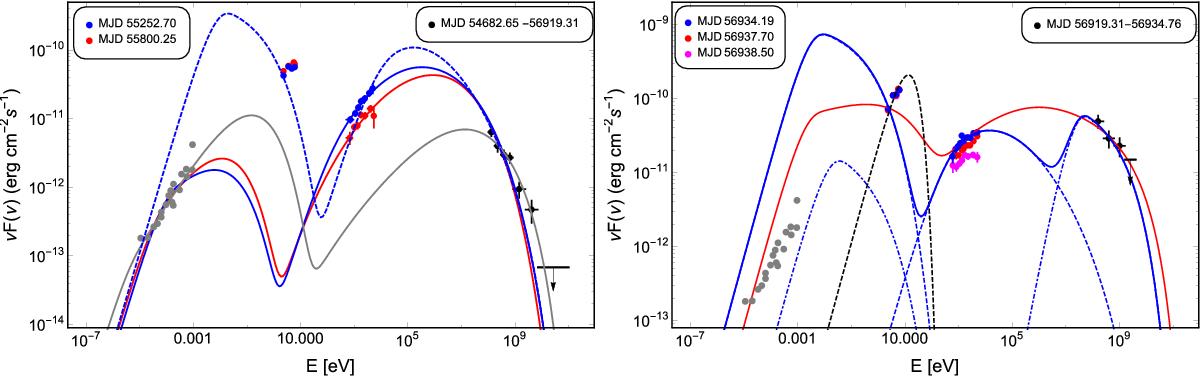
Broadband SED of 3C 120 core emission for quiescent (left) and flaring (right) states. Left panel: blue and red solid lines are the synchrotron/SSC model fitting for two different X-ray fluxes, taking into account the radio data and assuming Swift UVOT data are upper limits. Instead the dashed blue line is calculated assuming that optical/UV emission is also produced by the jet. Right panel: SED in flaring state fitting with one-zone synchrotron/SSC (red solid line) and two-zone SSC+ EIC (blue solid line) models. The model parameters are presented in Table 2.
Current usage metrics show cumulative count of Article Views (full-text article views including HTML views, PDF and ePub downloads, according to the available data) and Abstracts Views on Vision4Press platform.
Data correspond to usage on the plateform after 2015. The current usage metrics is available 48-96 hours after online publication and is updated daily on week days.
Initial download of the metrics may take a while.