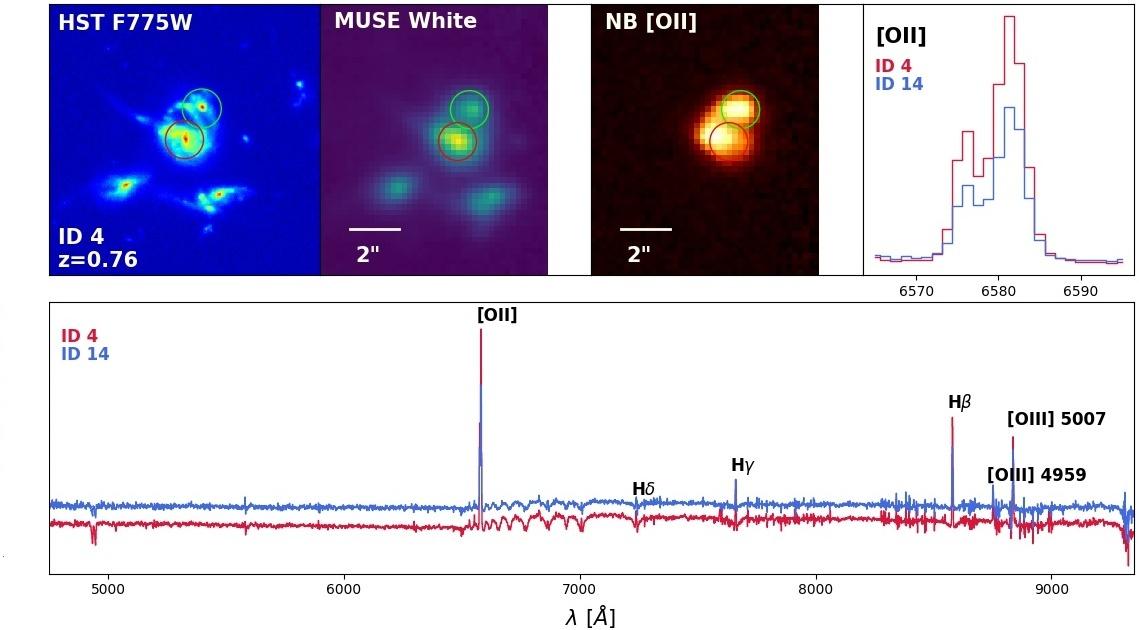
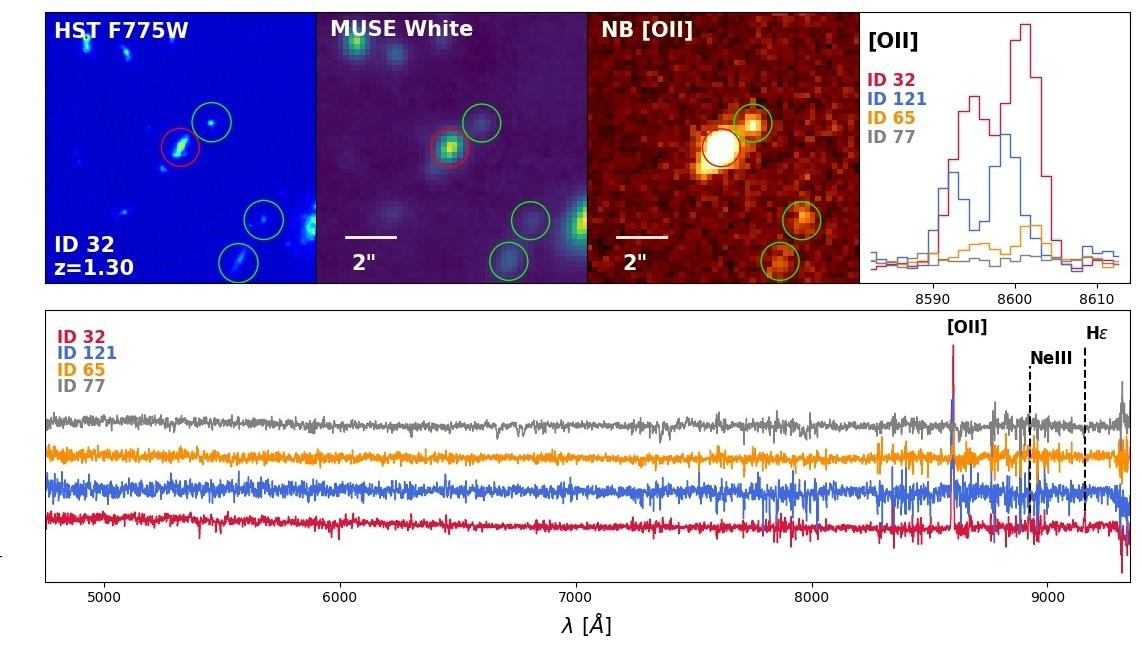
Fig. 3
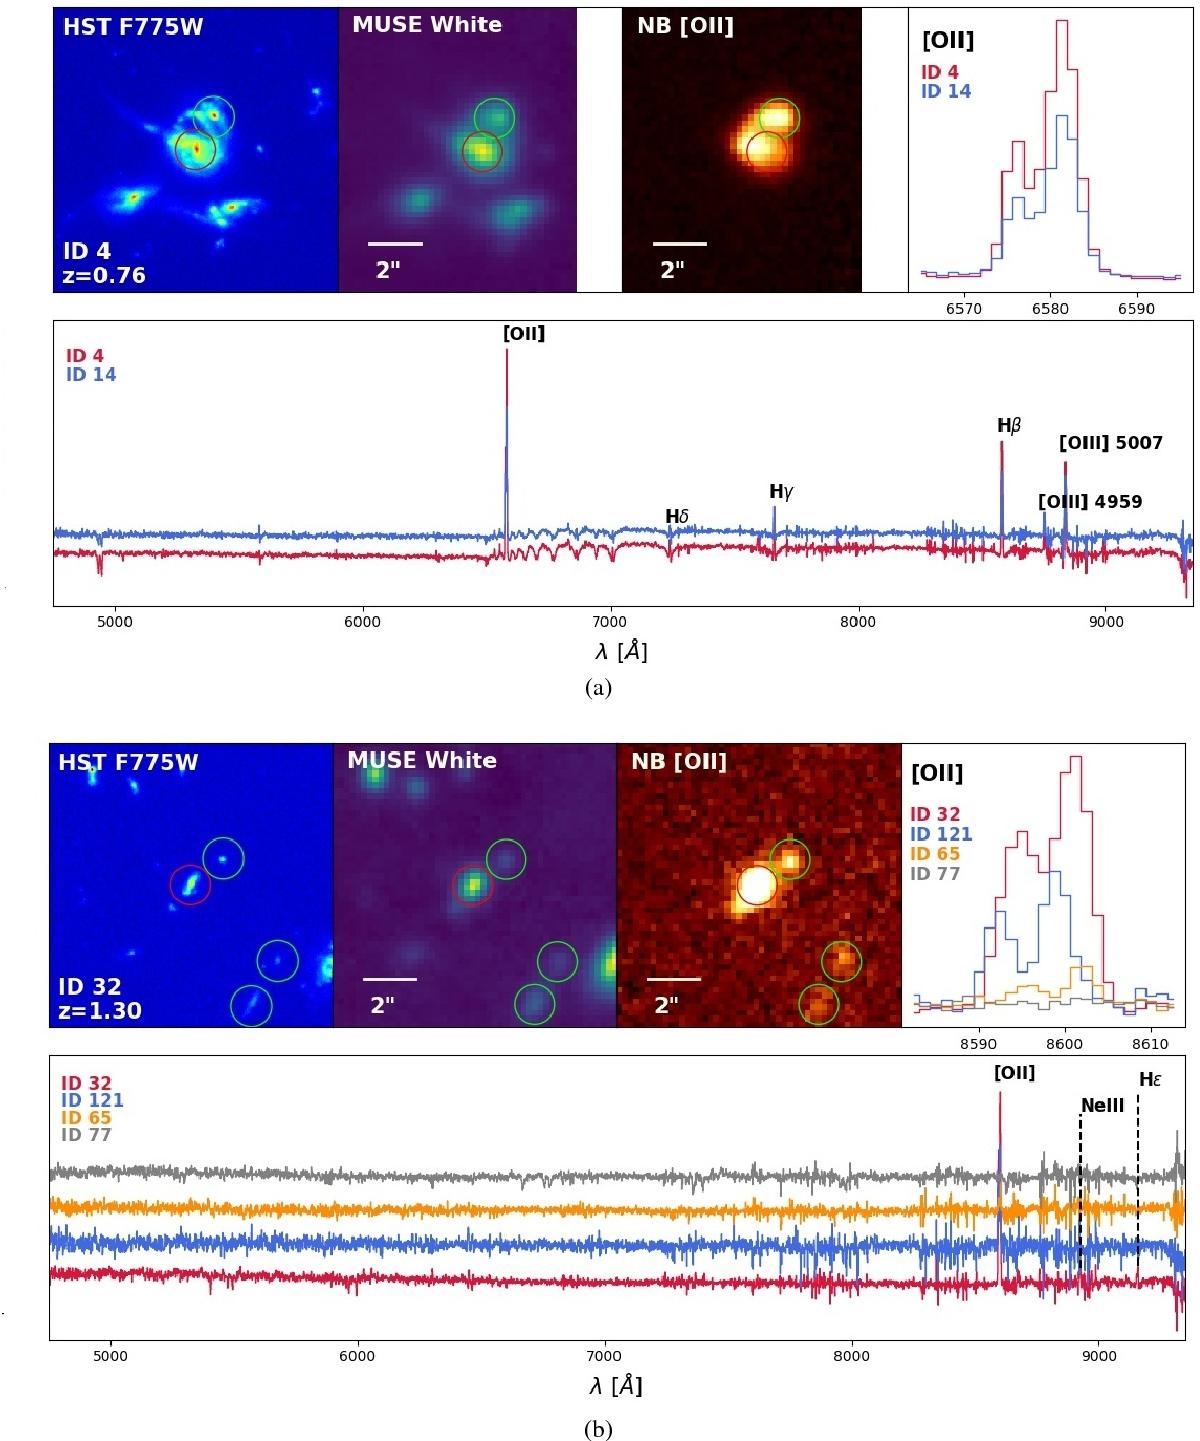
Examples of galaxy close pairs. Top line, from left to right: HST image in the F775W filter with the labelled MUSE ID and redshift of the primary galaxy, MUSE reconstructed white light image, narrowband image of one of the brightest emission lines of the pair, and the zoomed spectra around this line. Images are 10′′ in linear size and centred around the primary galaxy, i.e. the most massive one, circled in red. The green circle(s) denote its companion(s). Bottom line: spectrum (red for the primary and blue or other colours for its companion) over the whole wavelength range observed with MUSE, differentiated by an arbitrary offset. Fluxes are in arbitrary units. The main emission(absorption) lines are labelled in black(grey). Panel a: A low redshift close pair of galaxies in udf-10 at z = 0.76 with rp ~ 6 kpc and Δv ~ 7 km s-1. This pair has a strong [O ii]λλ3726, 3729 emission line slightly of-centred, and shows signs of interactions such as tidal tails. Panel b: A quadruplet of galaxies in udf-10 at z = 1.30 within a projected separation distance of rp ~ 41 kpc between the primary galaxy, MUSE ID 32, in the centre, and the most distant satellite galaxy at the bottom right of the image and within a maximum rest-frame velocity of Δv ~ 220 km s-1. The MUSE ID of the companion galaxies are, from top to bottom, 121, 77, and 65. Objects 32, 121, and 65 all have a secure spectroscopic redshift with a confidence flag in the measurement of 3, whereas object 77 has a confidence level of 1, which is taken into account in the computation of the fraction (see Sect. 5.2). The 1D spectrum of this galaxy shows a much fainter [O ii]λλ3726, 3729 emission than the other galaxies, but the galaxy is clearly identified in the narrowband image. The strong absorption lines in its spectrum belong to another source, ID 18. In such a case of multiple close pairs, where some of the paired galaxies have another partner, the number of close pairs corresponds to the number of satellite galaxies, i.e. we account for 3 close pairs in this system.
Current usage metrics show cumulative count of Article Views (full-text article views including HTML views, PDF and ePub downloads, according to the available data) and Abstracts Views on Vision4Press platform.
Data correspond to usage on the plateform after 2015. The current usage metrics is available 48-96 hours after online publication and is updated daily on week days.
Initial download of the metrics may take a while.