Fig. 11
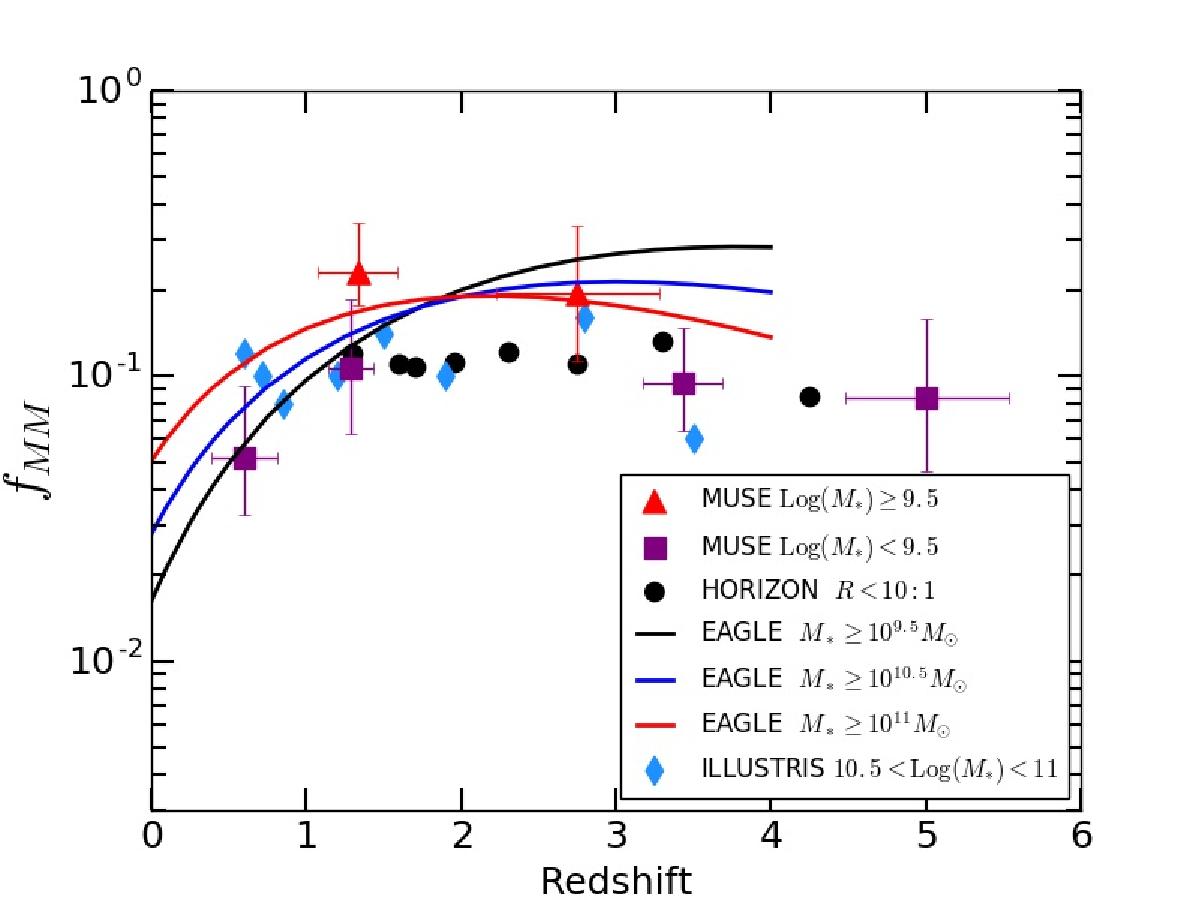
Major merger fraction compared to recent numerical simulations. Symbols with error bars are estimates from our MUSE sample divided into low-mass (![]() ; purple squares) and massive (> 109.5 M⊙; red triangles) galaxies. The black points indicate the predictions from the HORIZON-AGN simulation (Kaviraj et al. 2015) and correspond to the pair fraction for massive galaxies (
; purple squares) and massive (> 109.5 M⊙; red triangles) galaxies. The black points indicate the predictions from the HORIZON-AGN simulation (Kaviraj et al. 2015) and correspond to the pair fraction for massive galaxies (![]() ) with a mass ratio between the primary and companion galaxy that is lower than 10:1. The solid lines indicate estimates from the EAGLE simulations for three galaxy stellar mass ranges. For these predictions a combined power-law and exponential fitting function, fMM ~ a(1 + z)be− c(1 + z), was used (see Qu et al. 2017 for details). Finally, the blue diamonds correspond to the major pair fraction for massive galaxies in the ILLUSTRIS simulation (Snyder et al. 2017).
) with a mass ratio between the primary and companion galaxy that is lower than 10:1. The solid lines indicate estimates from the EAGLE simulations for three galaxy stellar mass ranges. For these predictions a combined power-law and exponential fitting function, fMM ~ a(1 + z)be− c(1 + z), was used (see Qu et al. 2017 for details). Finally, the blue diamonds correspond to the major pair fraction for massive galaxies in the ILLUSTRIS simulation (Snyder et al. 2017).
Current usage metrics show cumulative count of Article Views (full-text article views including HTML views, PDF and ePub downloads, according to the available data) and Abstracts Views on Vision4Press platform.
Data correspond to usage on the plateform after 2015. The current usage metrics is available 48-96 hours after online publication and is updated daily on week days.
Initial download of the metrics may take a while.