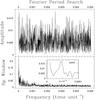
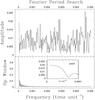
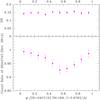
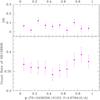
Fig. 5
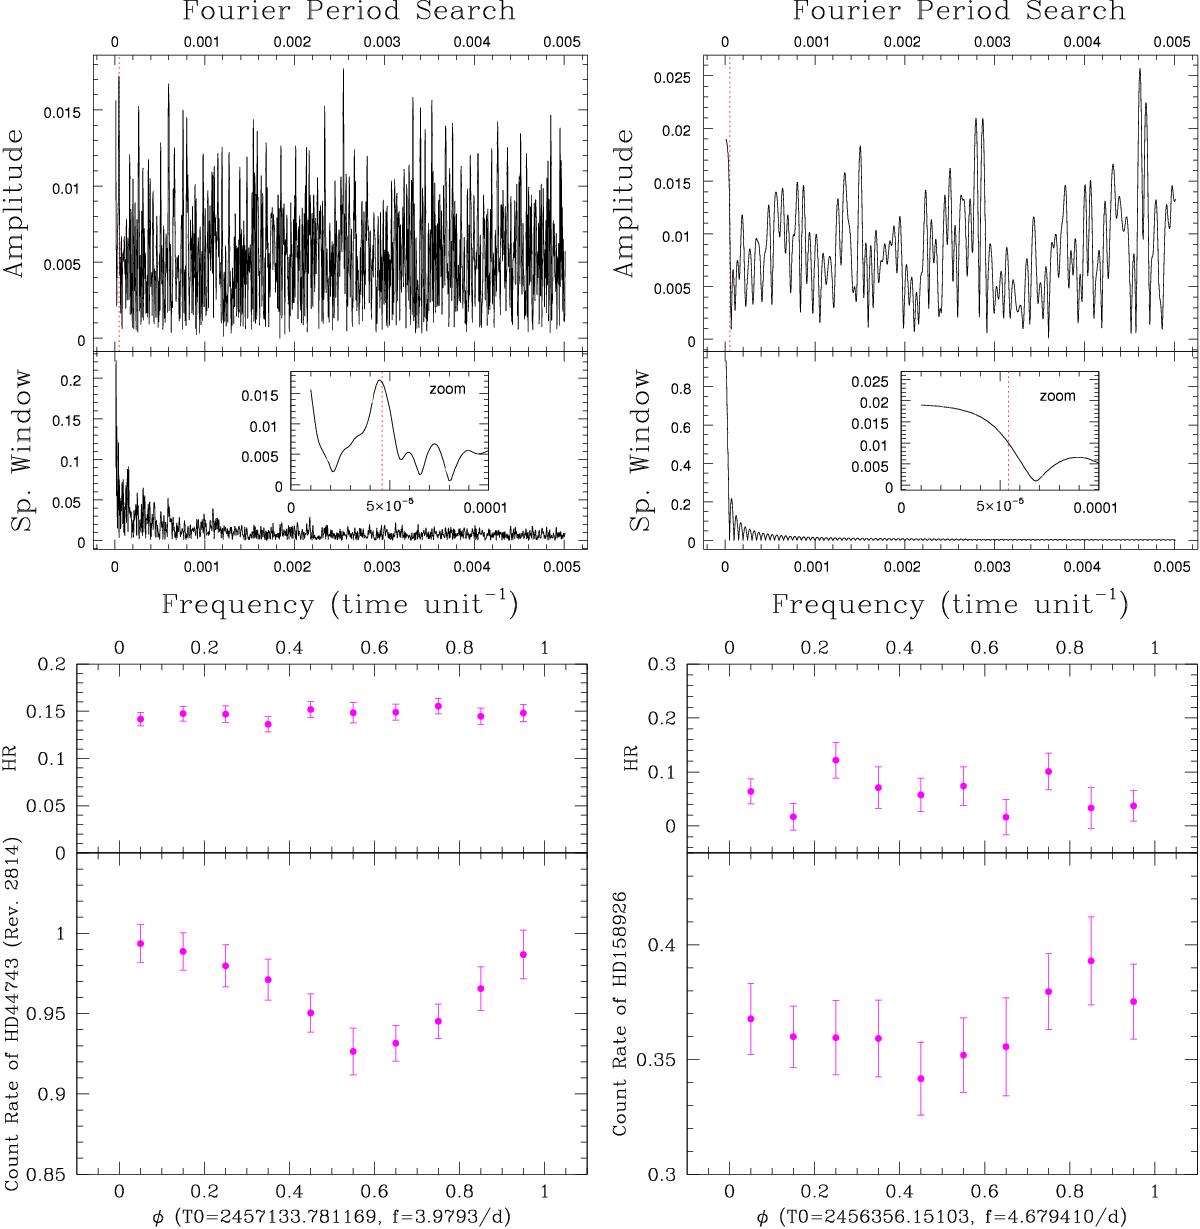
Top: periodograms based on the pn light curves with 100 s bins of HD 44743 (left, for Rev. 2814) and HD 158926 (right), along with their associated spectral window. An inset provides a zoom on the lowest frequencies with the β Cephei pulsation frequencies shown by the red dotted lines. Bottom: light curves of HD 44743 (left, for Rev. 2814) and HD158926 (right) folded using their dominant β Cephei frequency (see text). The values T0 are arbitrary and were chosen to correspond to the start time of the XMM-Newton observations (Table A.1). The count rates correspond to EPIC values (i.e. the addition of MOS1, MOS2, and pn count rates) while the hardness ratios, defined as in Fig. 4, correspond to means (i.e. [HR(MOS1) + HR(MOS2) + HR(pn)] /3). The phasing was here performed on light curves with 1 ks bins; the 100 s-binned light curves provide similar but slightly noisier results.
Current usage metrics show cumulative count of Article Views (full-text article views including HTML views, PDF and ePub downloads, according to the available data) and Abstracts Views on Vision4Press platform.
Data correspond to usage on the plateform after 2015. The current usage metrics is available 48-96 hours after online publication and is updated daily on week days.
Initial download of the metrics may take a while.