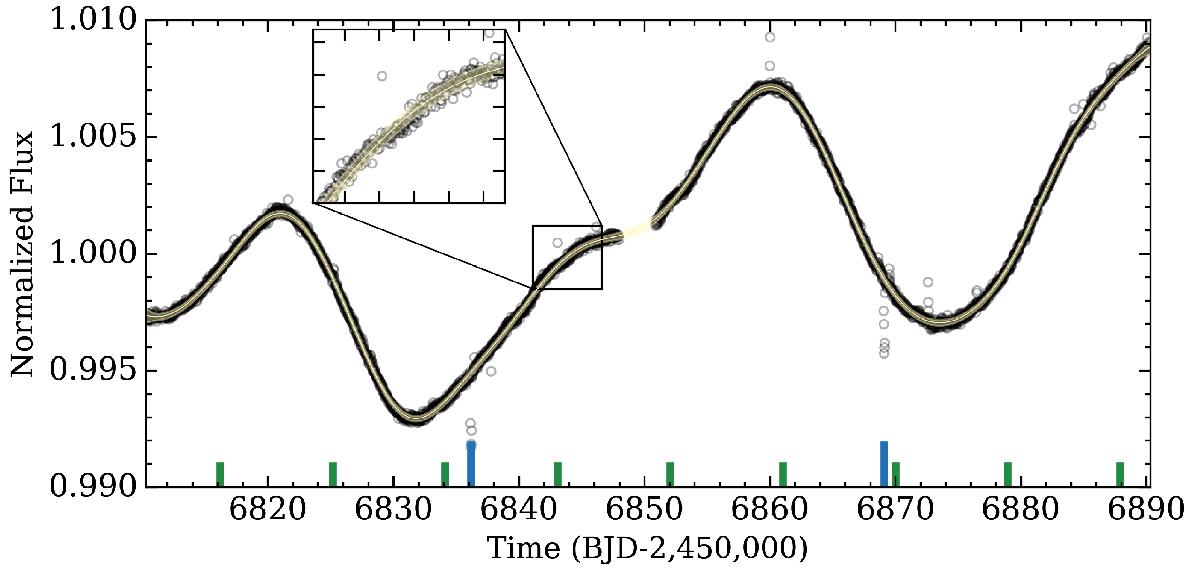
Fig. 1

K2 photometric light curve after the removal of known unphysical spurious signals. The two transits of K2-18b are highlighted by the ong blue ticks with the expected times of mid-transit for K2-18c highlighted with short green ticks (see Sect. 5). The solid yellow curve is the mean of the predictive GP distribution and the surrounding shaded regions mark its 99% confidence intervals. The upper left sub-panel is a magnified view of the highlighted region to aid in the visualization of the data and the GP fit.
Current usage metrics show cumulative count of Article Views (full-text article views including HTML views, PDF and ePub downloads, according to the available data) and Abstracts Views on Vision4Press platform.
Data correspond to usage on the plateform after 2015. The current usage metrics is available 48-96 hours after online publication and is updated daily on week days.
Initial download of the metrics may take a while.


