Fig. 4
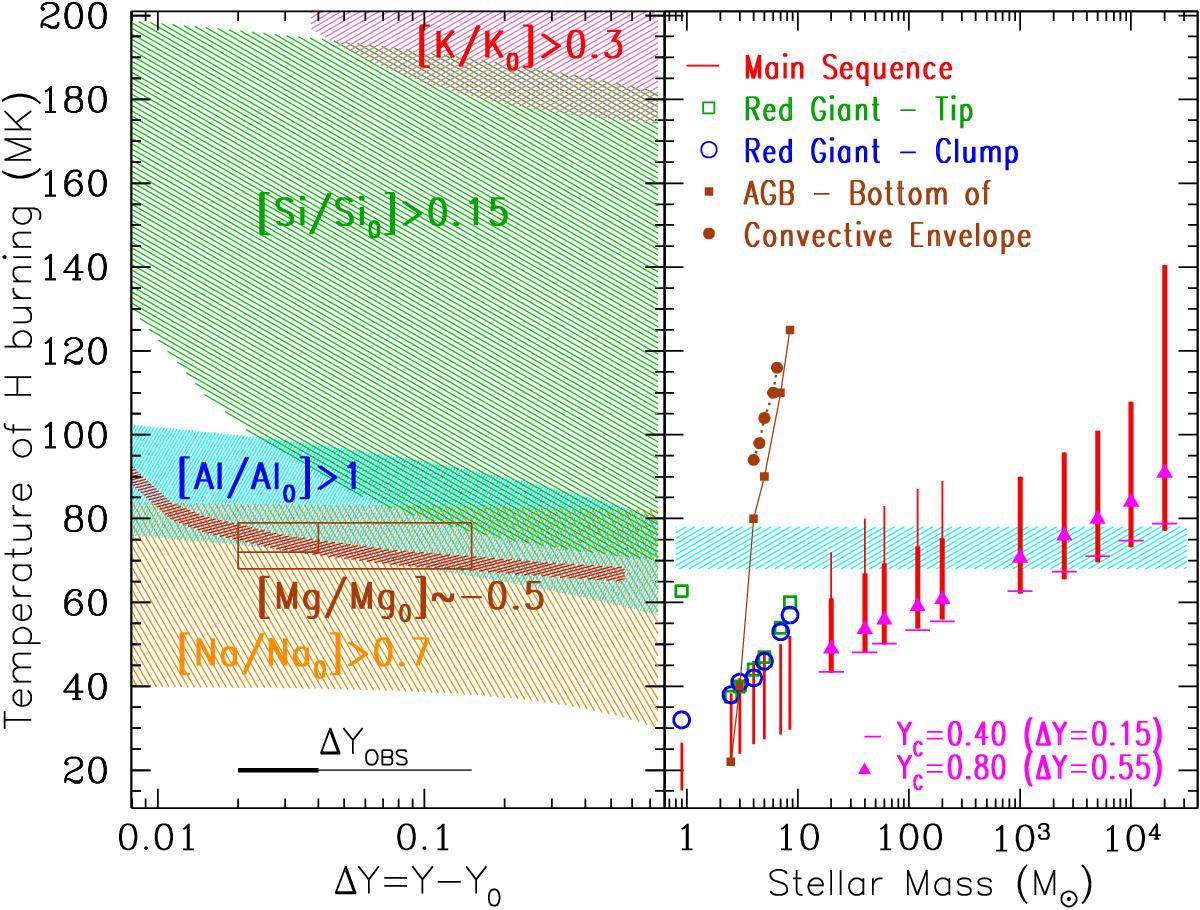
Left: shaded areas indicate the temperature range as a function of produced He amount (ΔY) where each of the corresponding elements is either overproduced (Na, Al, Si and K) or depleted (Mg) with respect to its initial value by the factors indicated; these factors correspond to the extreme abundances observed in NGC 2808 (see Table 1). The horizontal bar at the bottom corresponds to the observationally inferred variation in the He content of most globular clusters (thick portion) and of NGC 2808 (thin portion; see Sect. 2). The boxes around the Mg values correspond to these inferred variations and show explicitly why Mg is the most sensitive “thermometer” among those elements (see text). Right: H-burning temperatures at various phases of a star’s life as a function of initial stellar mass (see legend at the top of the figure, adapted from Prantzos et al. 2007). Vertical red segments (for central H-burning) start at the ZAMS and end at central H mass fraction X = 0.01 (thick portion) and X = 0 (thin portion, for stars between 20 and 200 M⊙). For the other phases we show only the maximum temperature reached in the H-burning zones of interest. In the bottom part, more details are given for massive star evolution. On the right side of the figure the temperatures are for the supermassive star models of Denissenkov (priv. comm.). The shaded rectangular area indicates the “triple point”, i.e. the temperature range (from the left side) allowing for the co-production of Na, Mg, and Al at the levels inferred from observations of NGC 2808.
Current usage metrics show cumulative count of Article Views (full-text article views including HTML views, PDF and ePub downloads, according to the available data) and Abstracts Views on Vision4Press platform.
Data correspond to usage on the plateform after 2015. The current usage metrics is available 48-96 hours after online publication and is updated daily on week days.
Initial download of the metrics may take a while.