Fig. 2
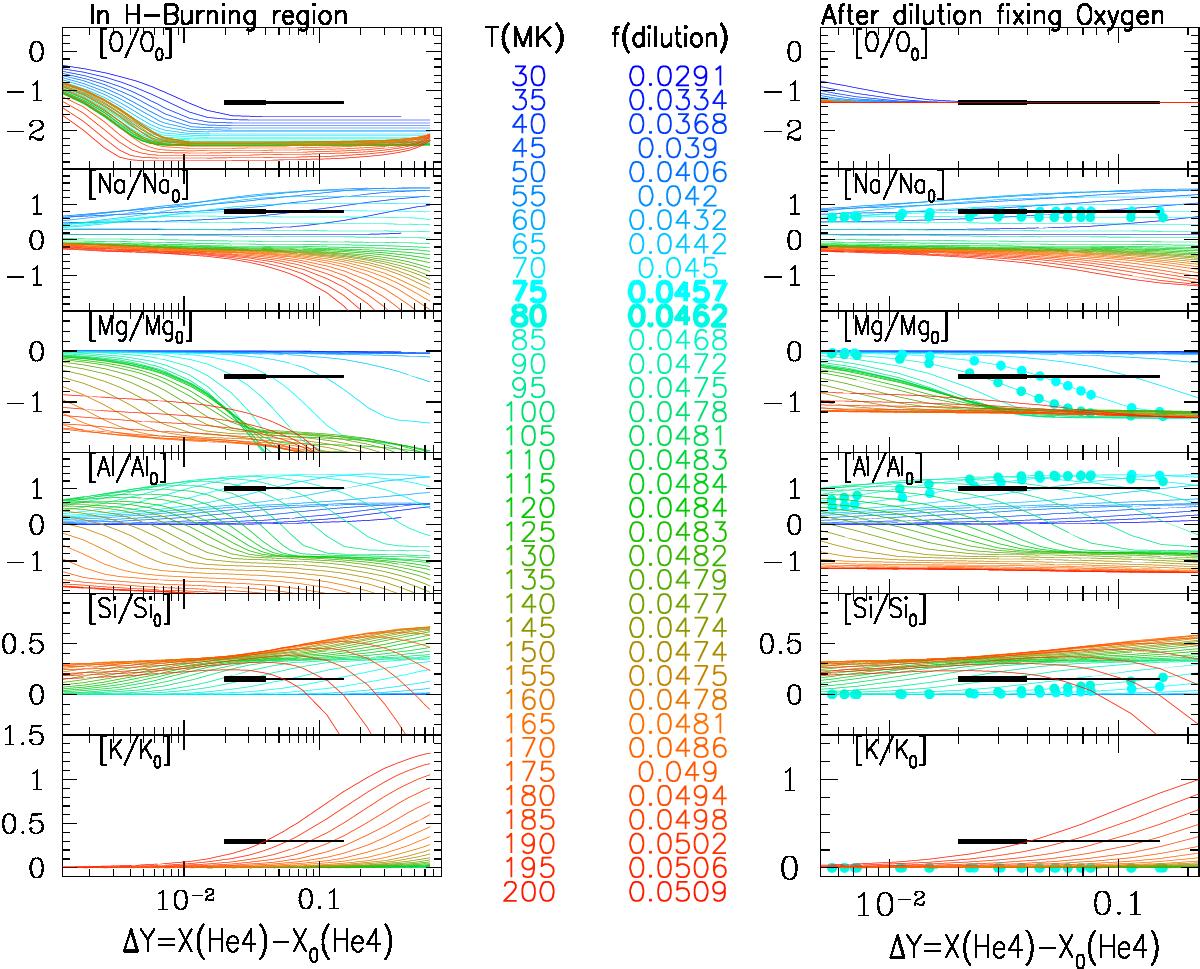
Left: evolution of the abundances (by mass fraction) of various elements as a function of increase in He mass fraction ΔY (used as a proxy for time), for different values of constant temperature (as indicated by the colour-coded values in the middle column), and for a constant density of ρ = 10g cm3; abundances are now expressed as [X/X0] = log(X) – log(X0), where X0 is the initial value. The horizontal bars in each panel indicate the differences between the extreme abundances (Δ[X/Fe] = [X/Fe]E – [X/Fe]0) observed in NGC 2808 (see Table 1). Their thick portion extends between ΔY = 0.02 and 0.04, the variation observed in most globular clusters, while the thin portion extends up to ΔY = 0.15, derived for NGC 2808 (see text for references). Right: same as on the left, but this time the equilibrium abundances of oxygen (which displays the largest depletion with respect to its initial value) are diluted by a factor f with pristine material to fix the observed extreme value in NGC 2808 for each temperature. That factor f, appearing in the middle column for each temperature, is then used to dilute all other abundances. Points are used for temperatures of 75 and 80 MK, where the curves for Na, Mg and Al match the observations (horizontal bars).
Current usage metrics show cumulative count of Article Views (full-text article views including HTML views, PDF and ePub downloads, according to the available data) and Abstracts Views on Vision4Press platform.
Data correspond to usage on the plateform after 2015. The current usage metrics is available 48-96 hours after online publication and is updated daily on week days.
Initial download of the metrics may take a while.