Free Access
Fig. 6
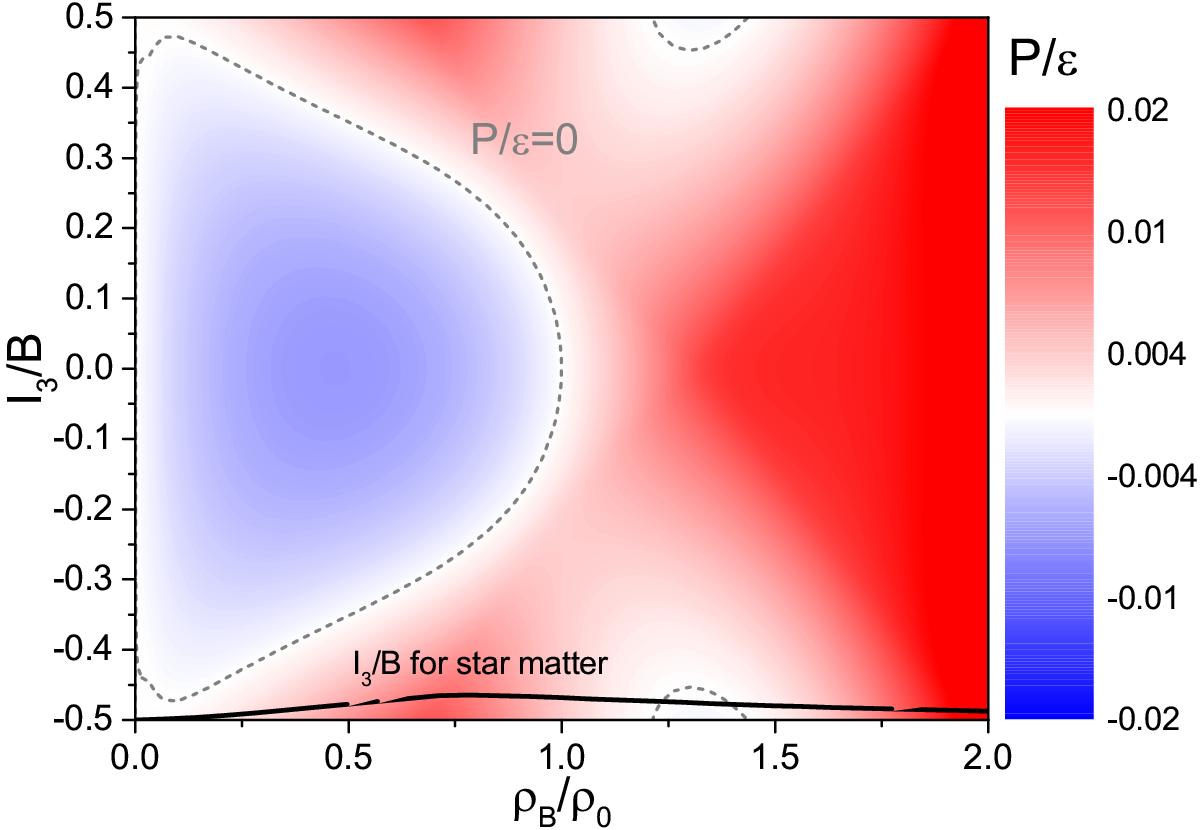
Contour plot of the ratio P/ε on a normalized I3 − ρB plane, showing regions of stability in red and those of instability in blue. The bold, black line represents the isospin-per-baryon for charge-neutral and chemically equilibrated matter.
Current usage metrics show cumulative count of Article Views (full-text article views including HTML views, PDF and ePub downloads, according to the available data) and Abstracts Views on Vision4Press platform.
Data correspond to usage on the plateform after 2015. The current usage metrics is available 48-96 hours after online publication and is updated daily on week days.
Initial download of the metrics may take a while.