Free Access
Fig. A.1
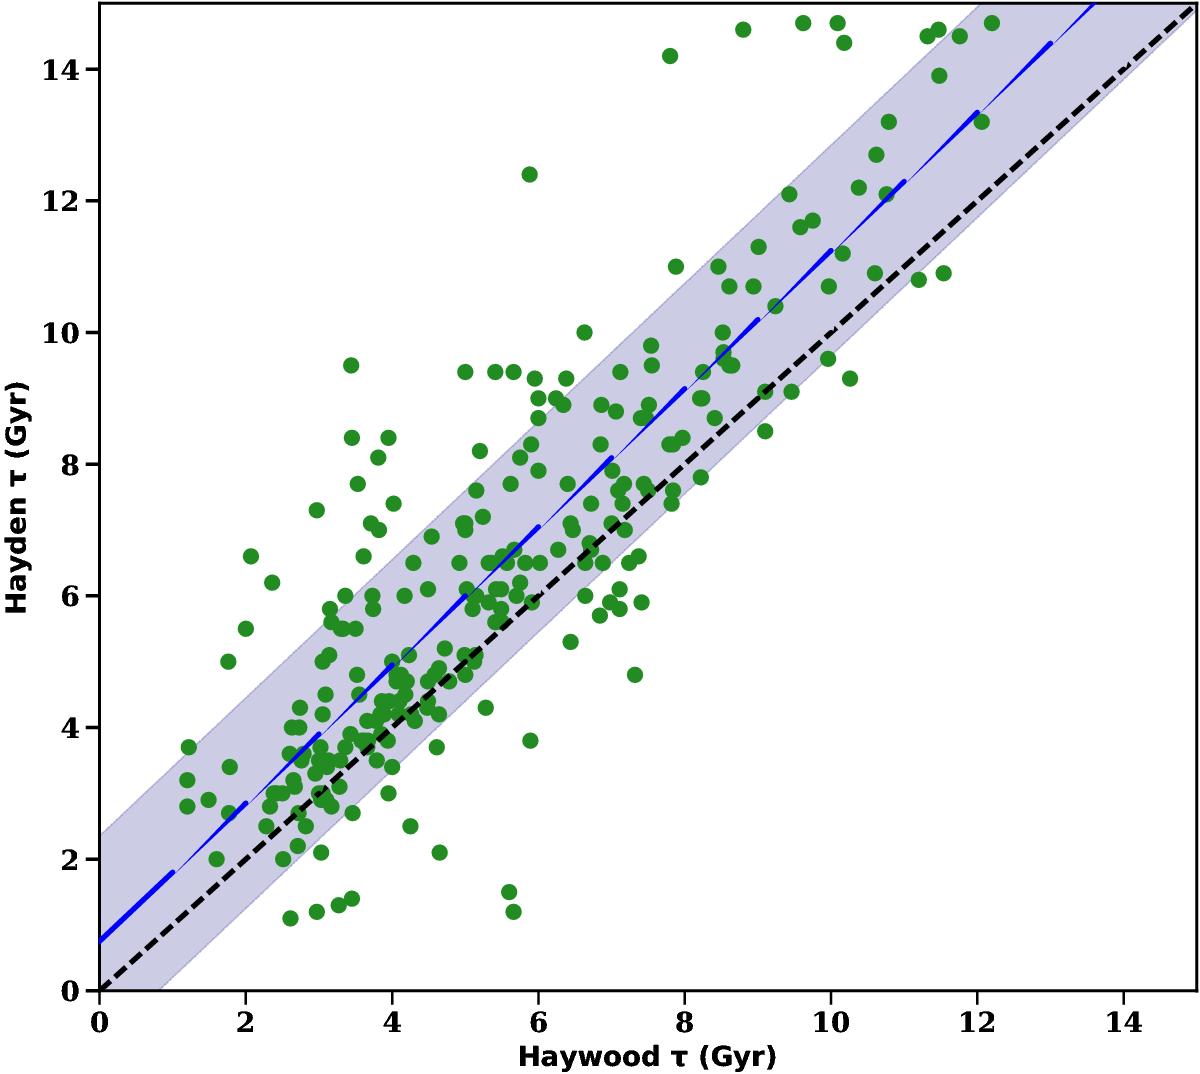
Comparison between our derived ages and those provided by Haywood et al. (2013). The dashed black line denotes the 1:1 relation, while the blue line denotes the relation between our derived ages and those of Haywood with a slope of 1.03. The blue shaded region shows the 1σ scatter of 1.6 Gyr.
Current usage metrics show cumulative count of Article Views (full-text article views including HTML views, PDF and ePub downloads, according to the available data) and Abstracts Views on Vision4Press platform.
Data correspond to usage on the plateform after 2015. The current usage metrics is available 48-96 hours after online publication and is updated daily on week days.
Initial download of the metrics may take a while.