Fig. 3
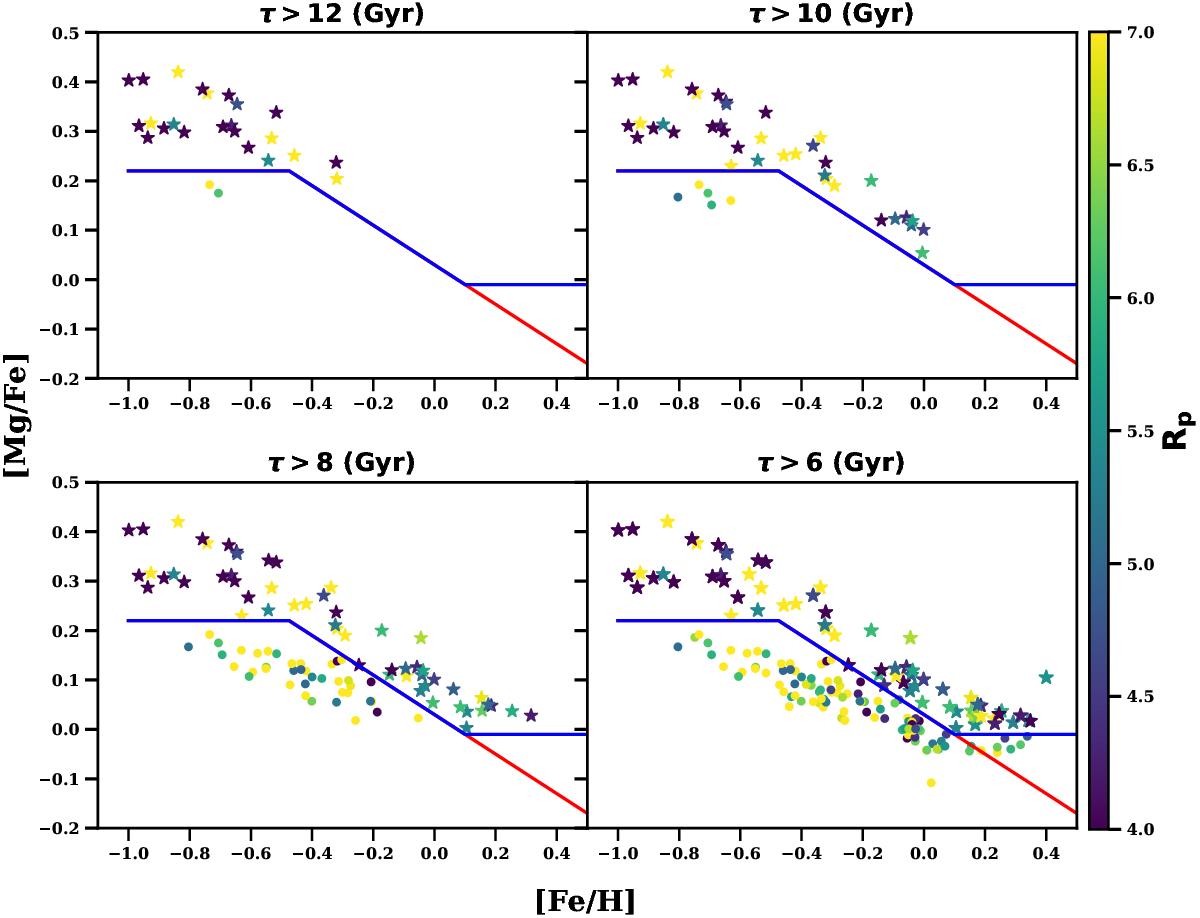
[Mg/Fe] vs. [Fe/H] plane as a function of various age ranges, going from oldest to younger stellar populations. Stars are color coded by their perigalacticons Rp. The blue and red lines are the same as in Fig. 1, where the high-[Mg/Fe] population are denoted by star symbols and the low-[Mg/Fe] population are denoted by circles.
Current usage metrics show cumulative count of Article Views (full-text article views including HTML views, PDF and ePub downloads, according to the available data) and Abstracts Views on Vision4Press platform.
Data correspond to usage on the plateform after 2015. The current usage metrics is available 48-96 hours after online publication and is updated daily on week days.
Initial download of the metrics may take a while.