Fig. 1
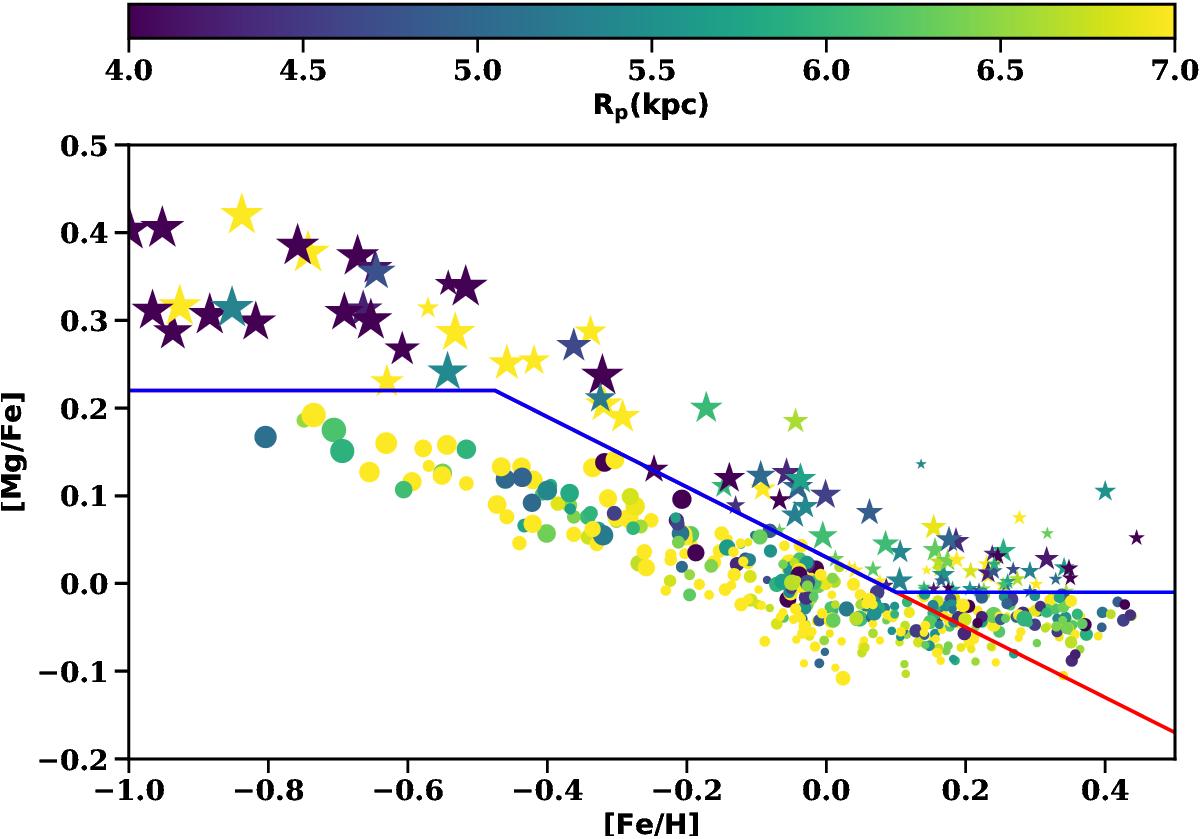
[Mg/Fe] vs. [Fe/H] plane for the HARPS sample with reliable age estimates. The blue line denotes our chemical separation between thin and thick disks, where the thick disk stars (star symbol) are shown above the line and thin disk stars (circle symbol) below the line. The size of each data point denotes the relative age of each star; the larger points are older than smaller points. Stars are color coded by their Rp. The color bar stops at Rp = 7 kpc to prevent color saturation of stars coming from the inner Galaxy. Which sequence the most metal-rich, solar-[Mg/Fe] stars belong to is unclear, and we show the red line as an example of a different potential split between stellar population groups.
Current usage metrics show cumulative count of Article Views (full-text article views including HTML views, PDF and ePub downloads, according to the available data) and Abstracts Views on Vision4Press platform.
Data correspond to usage on the plateform after 2015. The current usage metrics is available 48-96 hours after online publication and is updated daily on week days.
Initial download of the metrics may take a while.