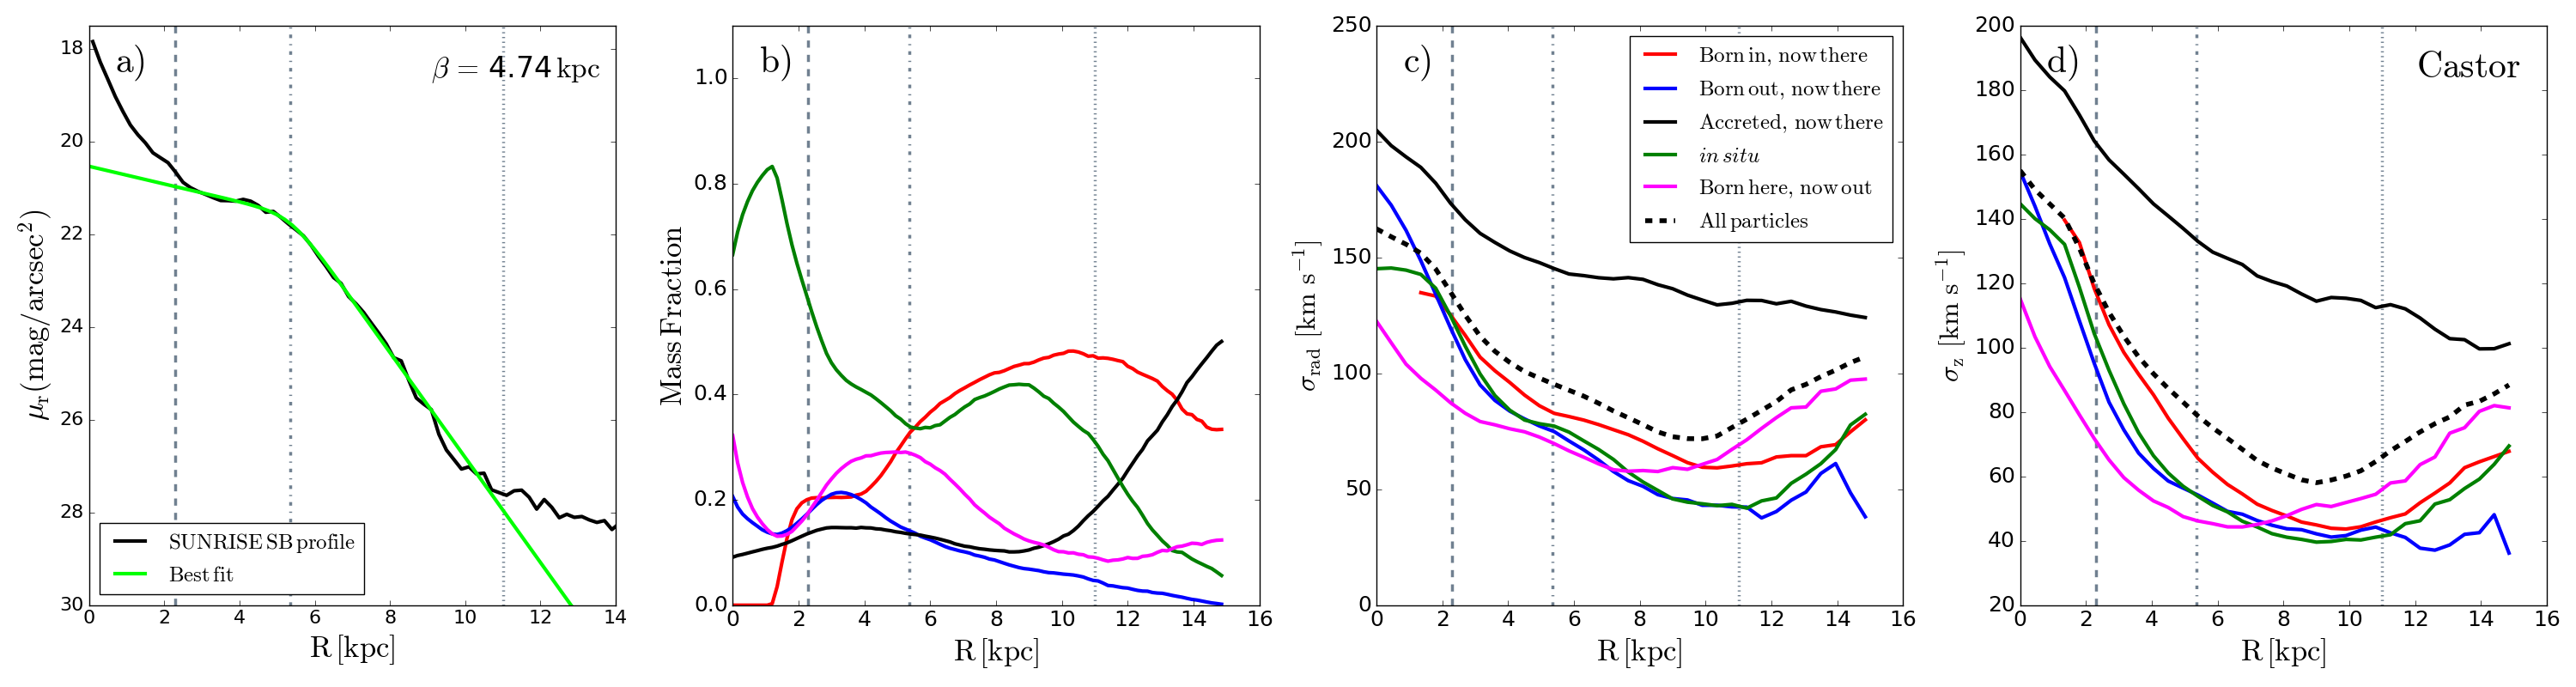
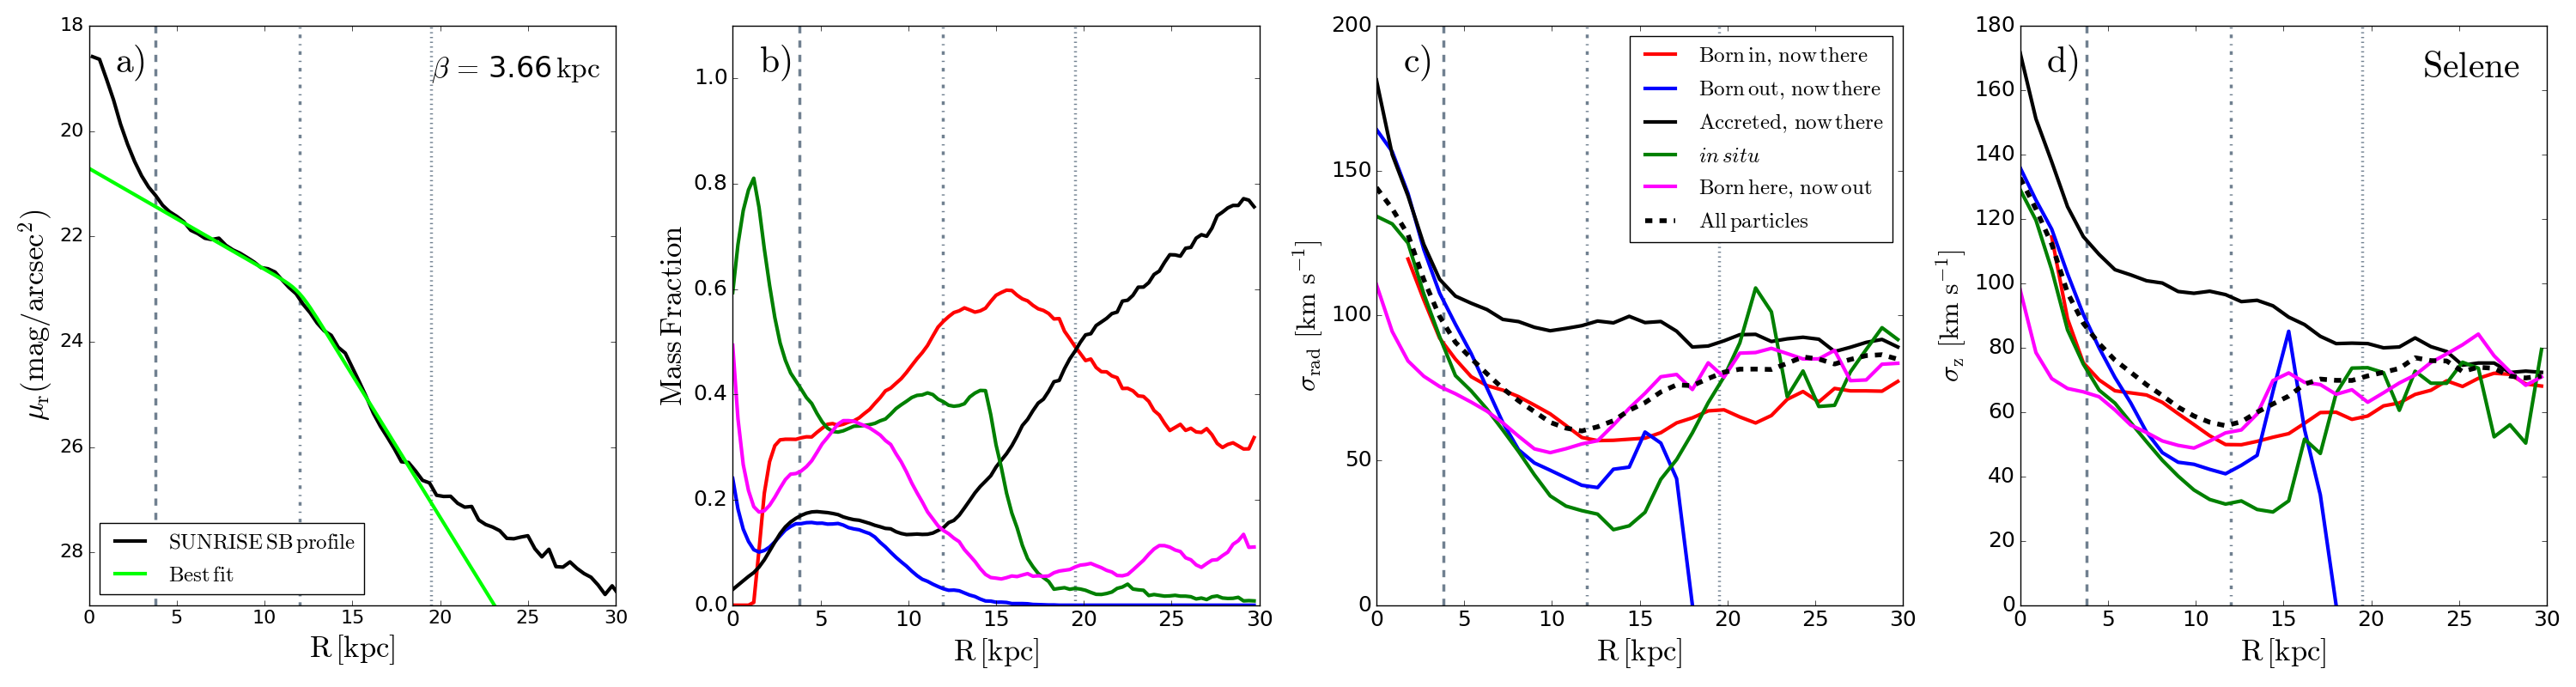
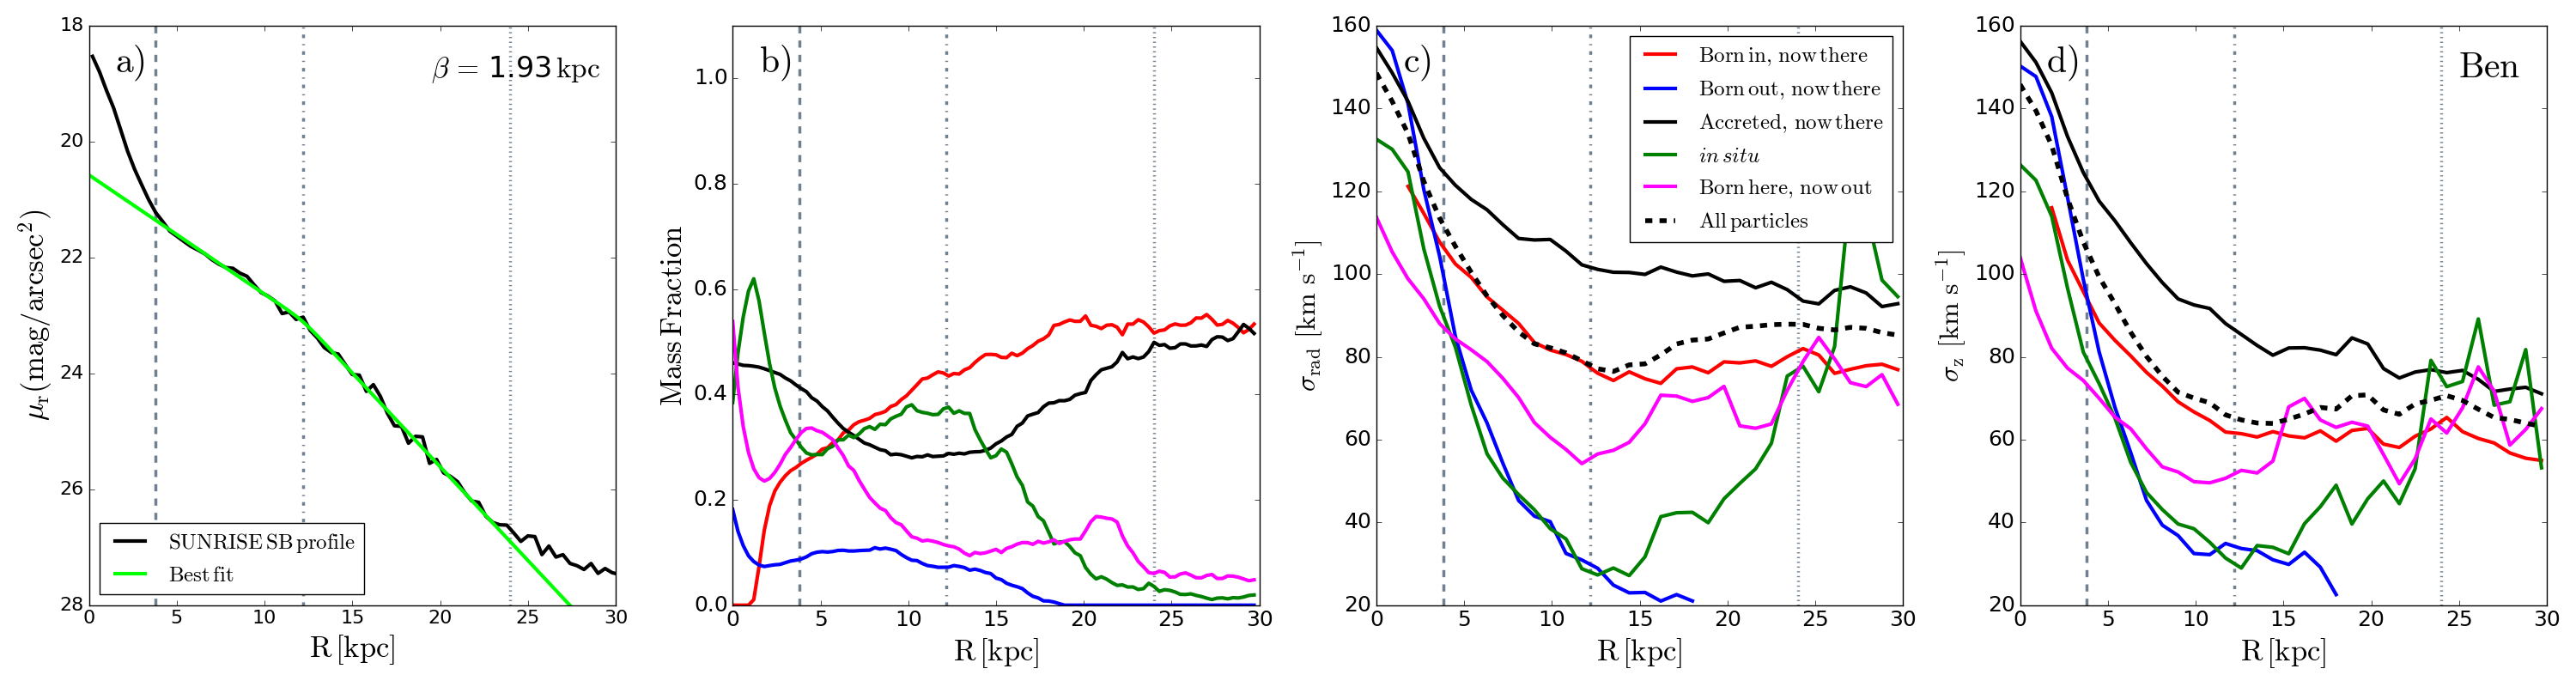
Fig. 1
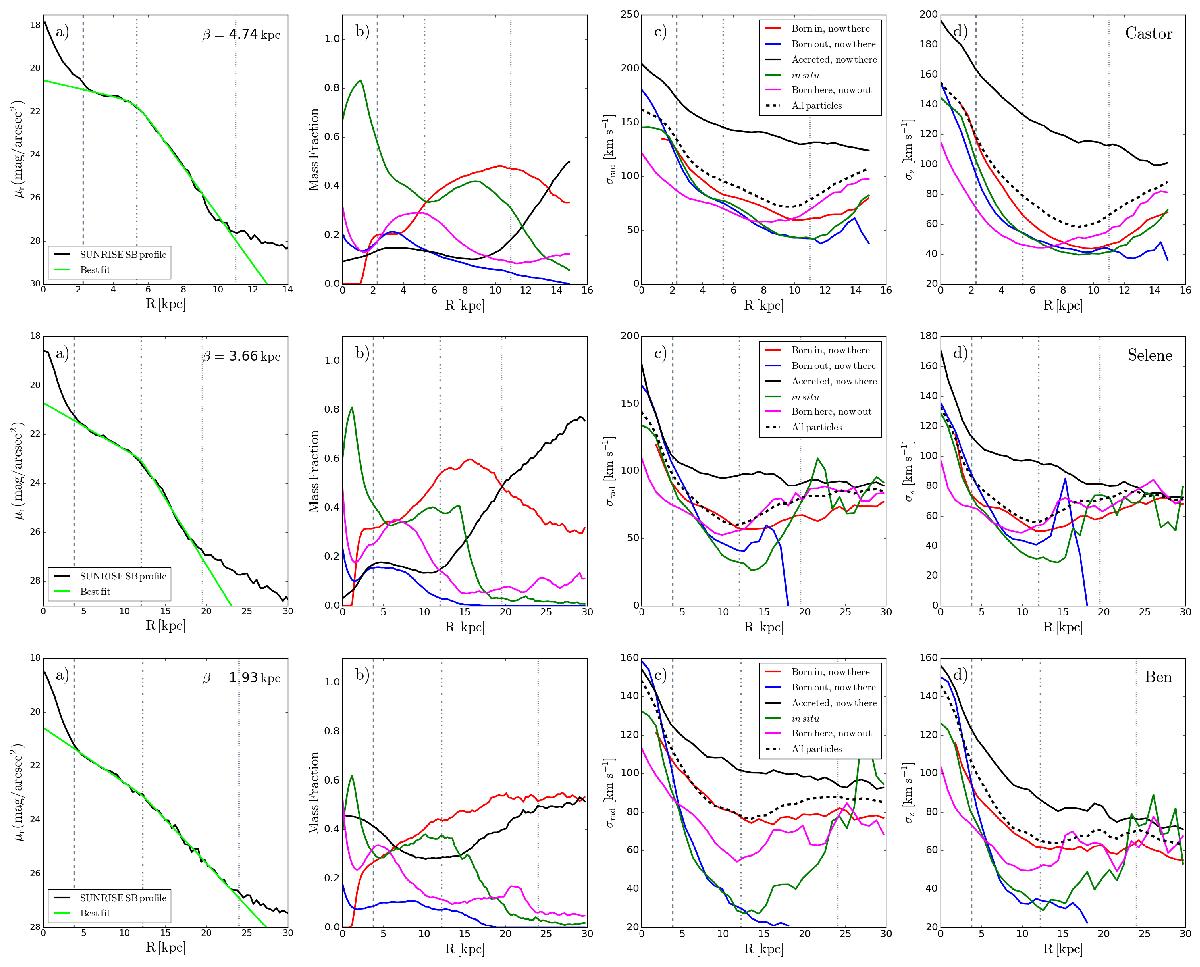
Characterisation of the light, radial redistribution, and velocity dispersion profiles of the RaDES galaxies. Panel a: surface Brightness profiles in SDSS r band for three type-II galaxies with different break strengths (Castor, Selene, and Ben). The black solid line represents the simulated (SUNRISE) SB profile while the light-green solid line is the best fit of the disc. Afterwards, from left to right: panel b: radial redistribution of the stellar mass fraction; panel c: radial velocity dispersion profiles; and panel d: vertical velocity dispersion profiles for different subpopulations of stars. The different stellar subpopulations analysed include, for these three galaxies, stars not experiencing radial motions (green), those born at lower galactocentric distances and now found there (red), those born at higher galactocentric distances and now found there (blue), those born at that radius and currently located at a larger radius (magenta), and those coming from satellites (black). We have also included the radial and vertical velocity dispersion profiles considering all star particles in the simulation (black dashed lines). β, defined as hin−hout, is indicated as an inset. The vertical lines in all panels are located at the end of the bulge-dominated region (μmodel−μobserved< 0.1 mag arcsec-1, grey dashed line), the type-II break (grey dotted-dashed line), and the type-III break (grey dotted line). See text for further details.
Current usage metrics show cumulative count of Article Views (full-text article views including HTML views, PDF and ePub downloads, according to the available data) and Abstracts Views on Vision4Press platform.
Data correspond to usage on the plateform after 2015. The current usage metrics is available 48-96 hours after online publication and is updated daily on week days.
Initial download of the metrics may take a while.