Fig. 11
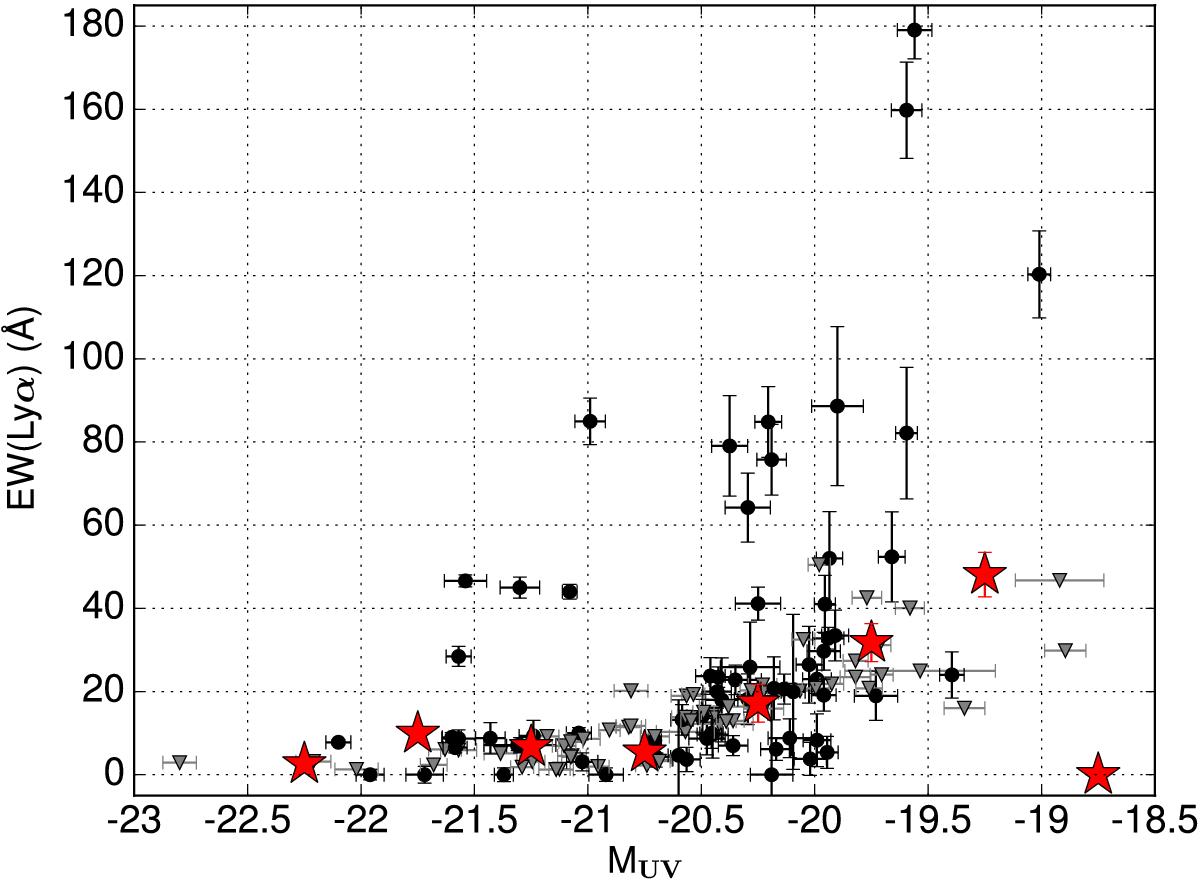
EW(Lyα) vs. MUV. We show individual Lyα detections with black dots and 3σ upper limits with gray downward triangles. We also show the average EW in magnitude bins (red stars). These average values are derived by setting EW(Lyα) to zero for all undetected objects, which should provide a good approximation of the true relation between EW(Lyα) and MUV (Schenker et al. 2014).
Current usage metrics show cumulative count of Article Views (full-text article views including HTML views, PDF and ePub downloads, according to the available data) and Abstracts Views on Vision4Press platform.
Data correspond to usage on the plateform after 2015. The current usage metrics is available 48-96 hours after online publication and is updated daily on week days.
Initial download of the metrics may take a while.