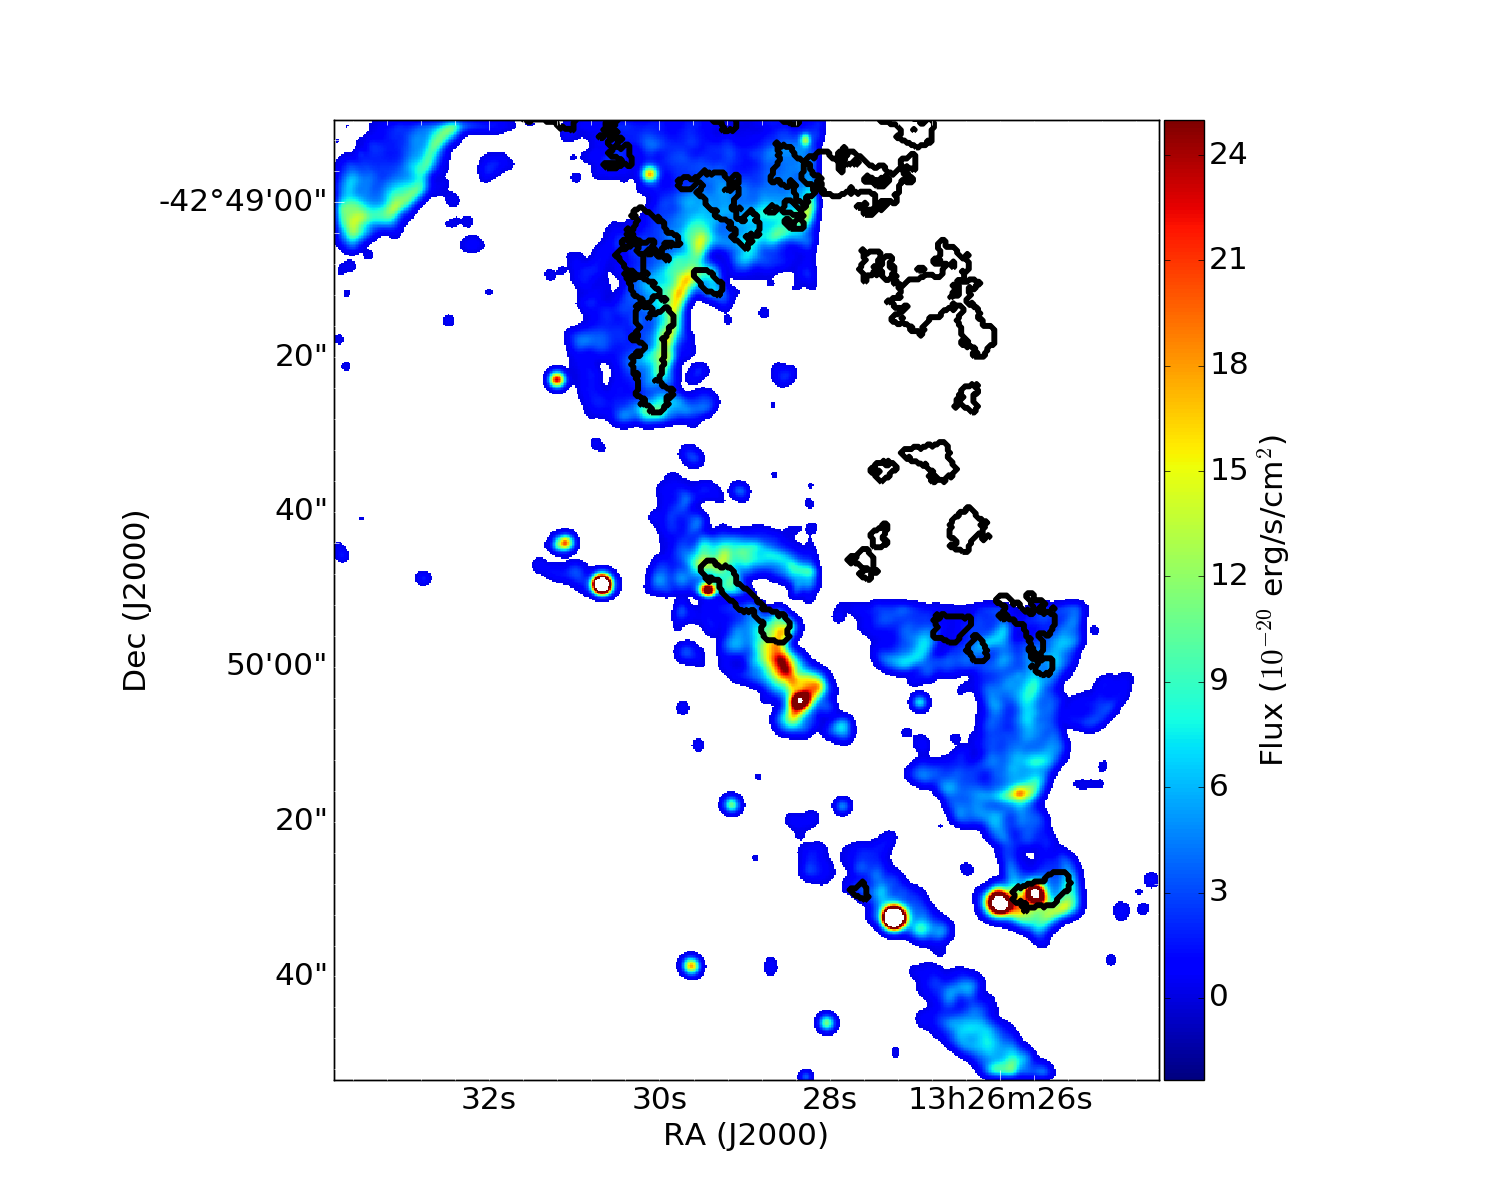
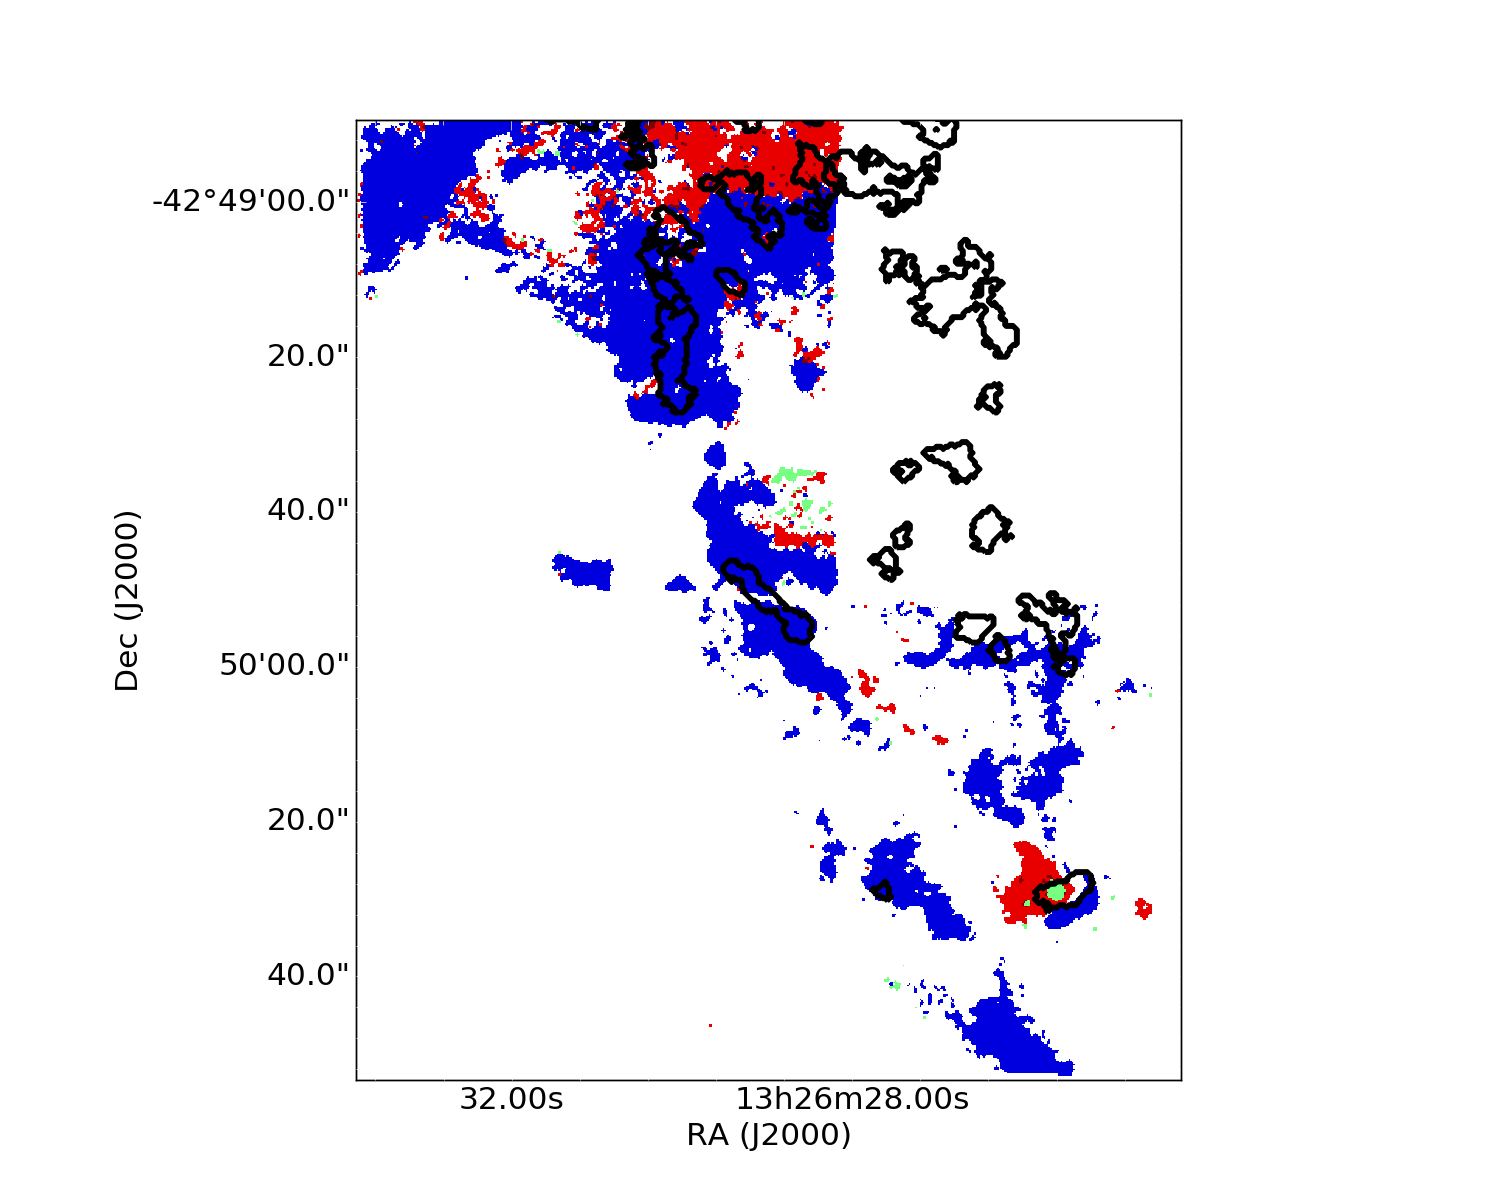
Fig. 8
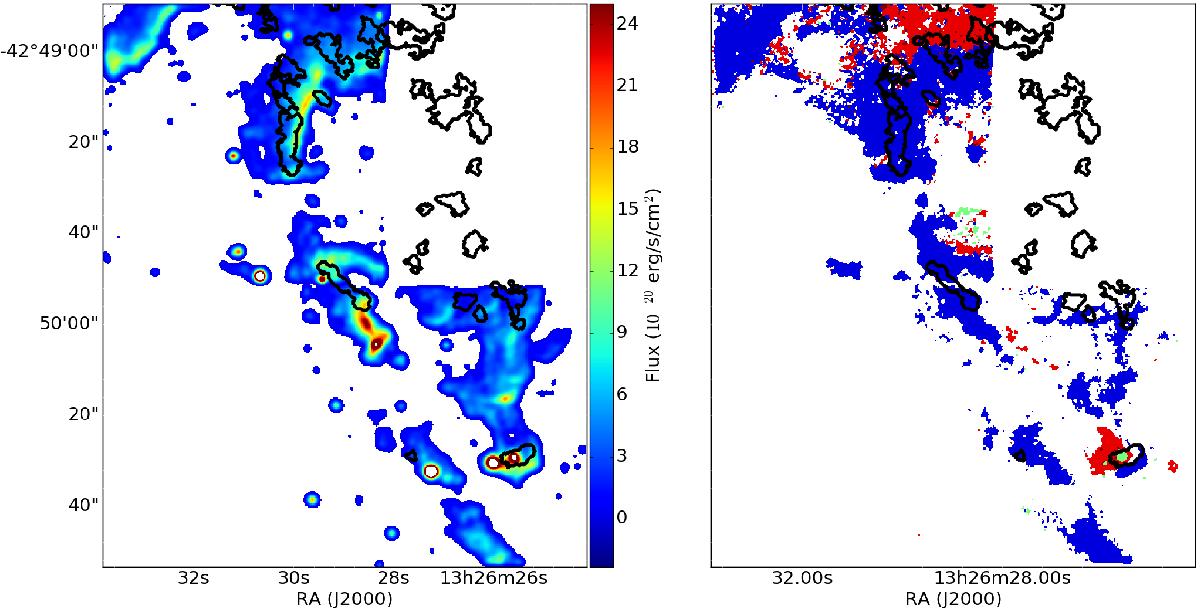
Maps of the Hα-[NII] flux from MUSE (left) and the excitation processes of the CO structures (right). The black contours represent the ALMA CO(1–0) emission distribution. The BPT diagram was computed for the velocity range −330 <v< −120km s-1. Star formation is represented in green and AGN or shocks are indicated in blue. Red corresponds to a composite of star formation and AGN/shocks. The CO clouds in the Horseshoe complex are associated with shock-excited Hα emission, except for one clump that is associated with the star-forming region from Santoro et al. (2016) and young stellar clusters.

Current usage metrics show cumulative count of Article Views (full-text article views including HTML views, PDF and ePub downloads, according to the available data) and Abstracts Views on Vision4Press platform.
Data correspond to usage on the plateform after 2015. The current usage metrics is available 48-96 hours after online publication and is updated daily on week days.
Initial download of the metrics may take a while.