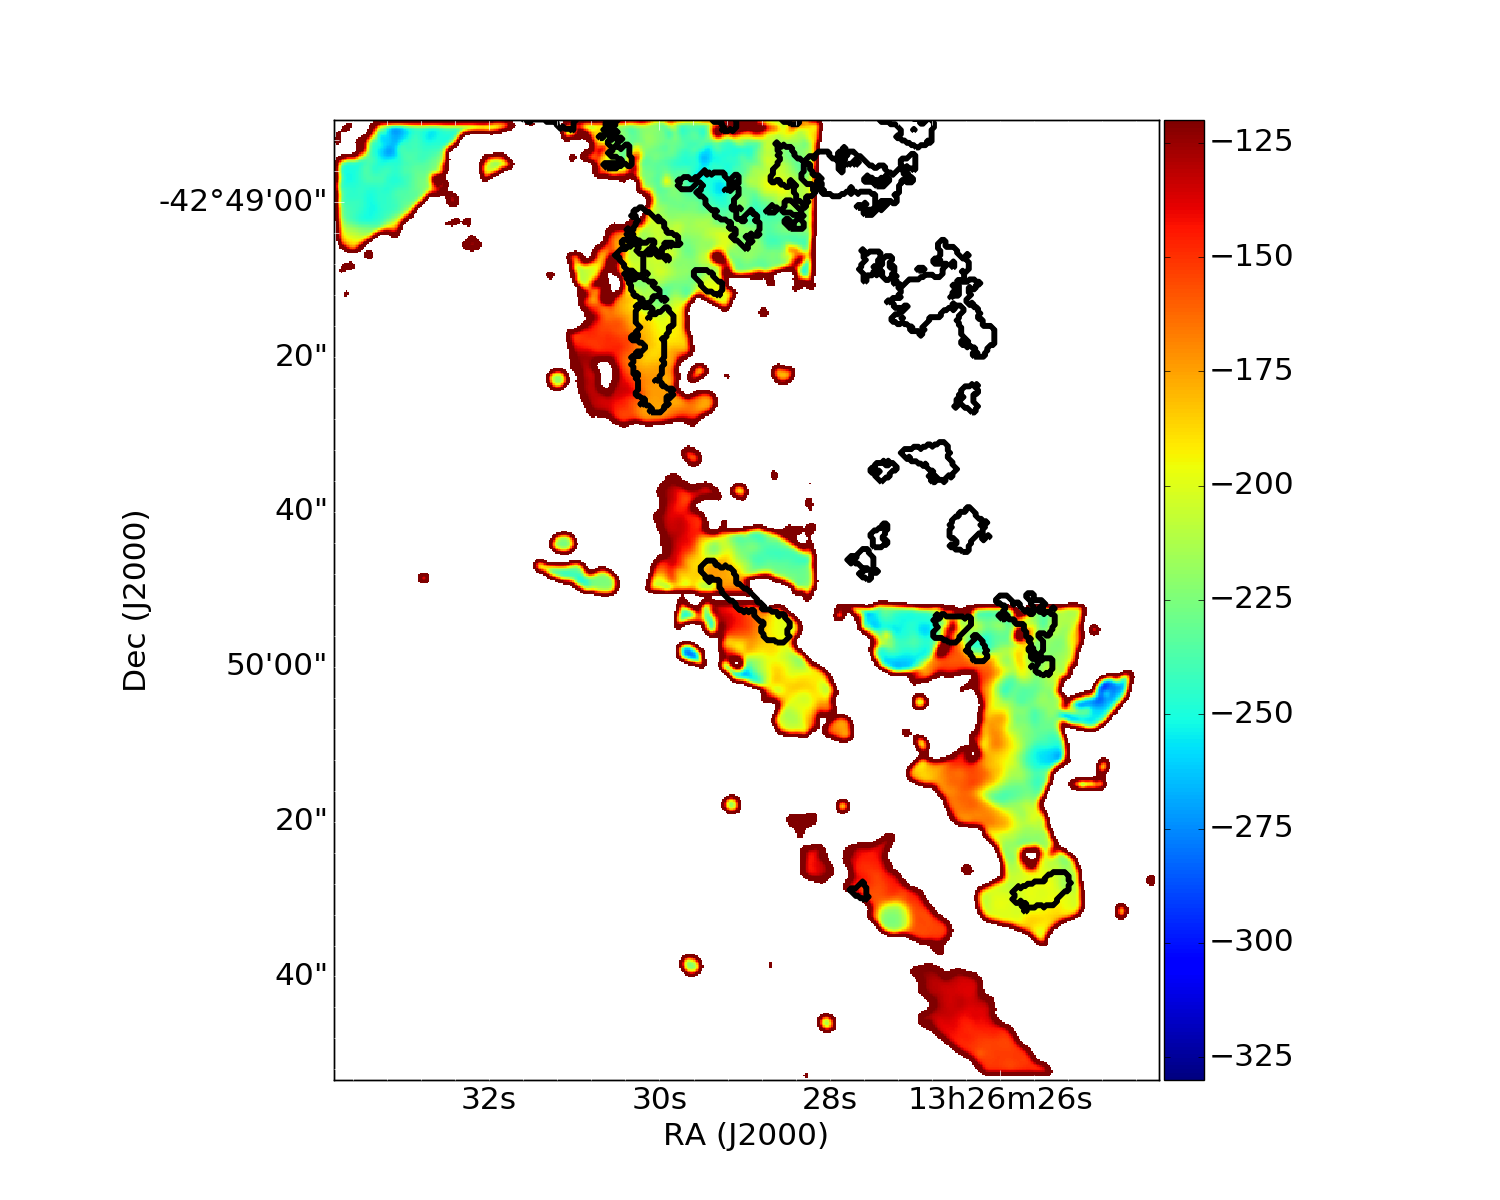
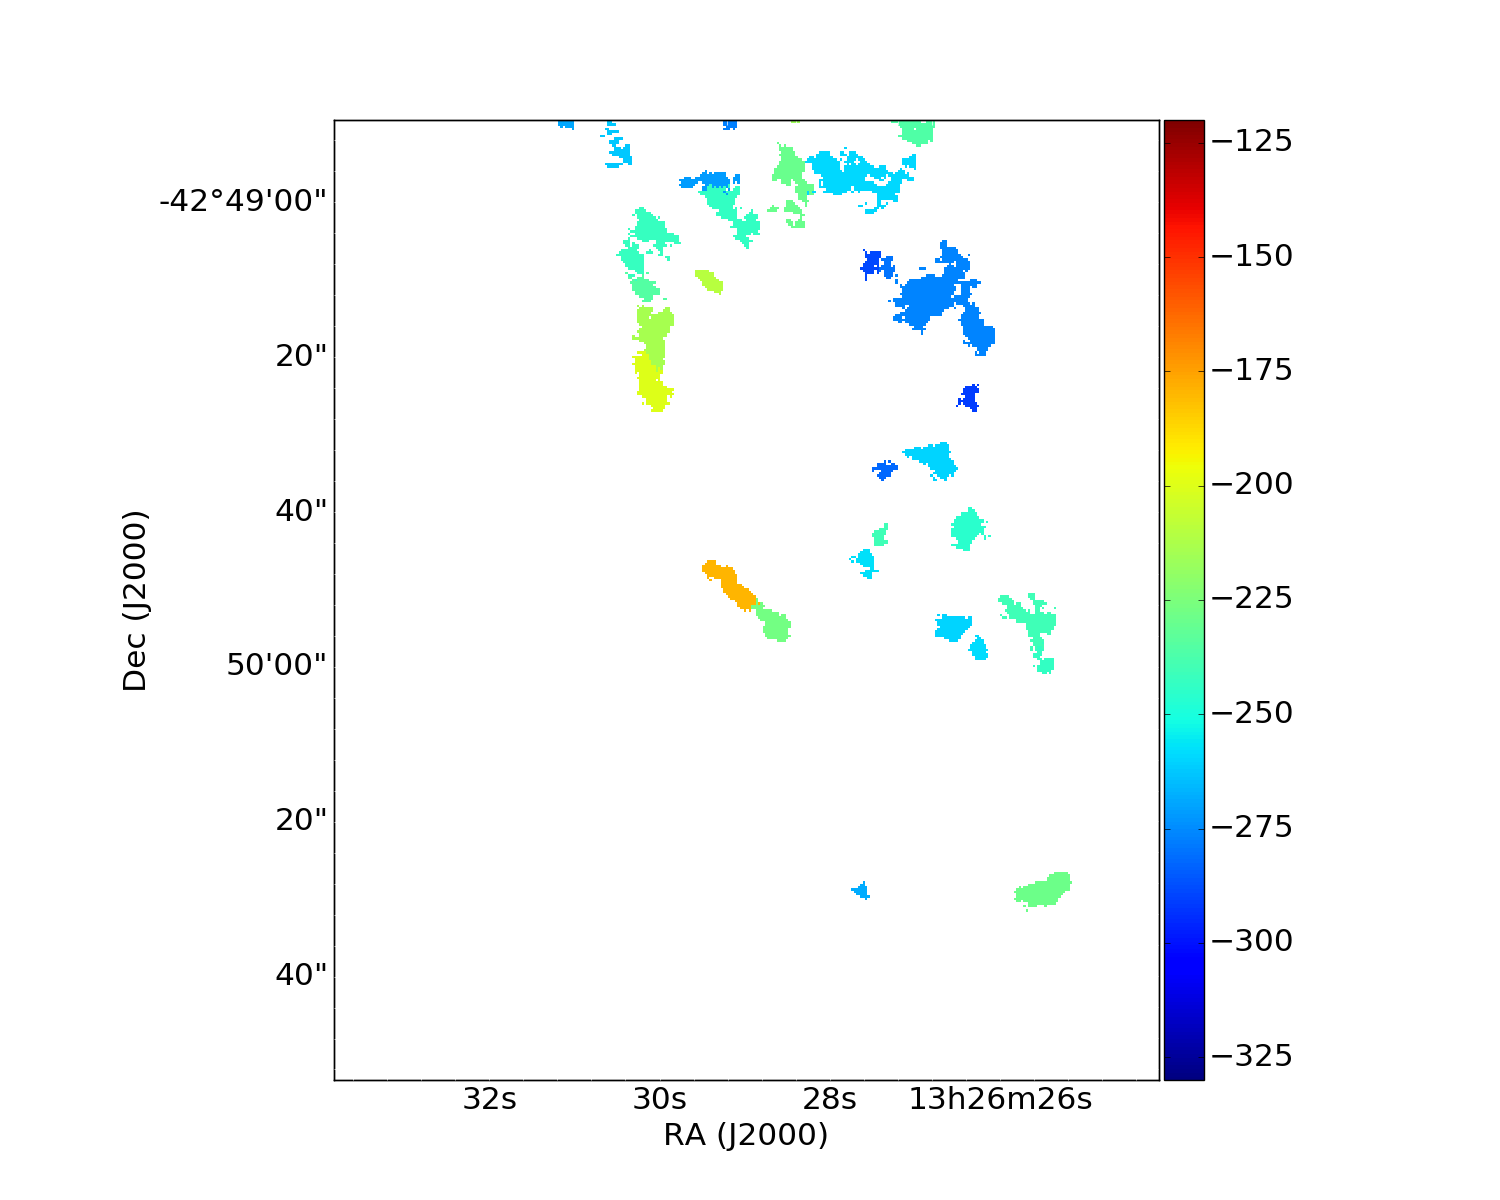
Fig. 7
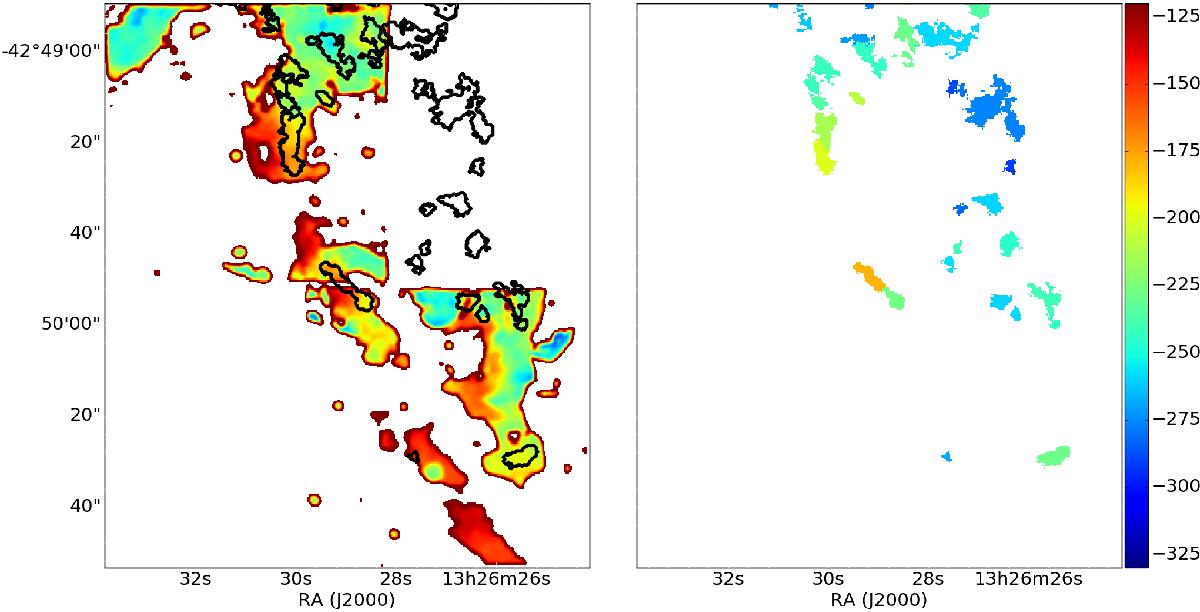
Velocity maps in km s-1 of the Hα (left) and CO emission (right). The black contours in the left panel represent the ALMA CO(1–0) emission distribution. The colour scale is the same for both maps, with a velocity range −330 <v< −120km s-1, relative to Centaurus A. It is thus clear that the CO is blueshifted compared to the Hα emission.

Current usage metrics show cumulative count of Article Views (full-text article views including HTML views, PDF and ePub downloads, according to the available data) and Abstracts Views on Vision4Press platform.
Data correspond to usage on the plateform after 2015. The current usage metrics is available 48-96 hours after online publication and is updated daily on week days.
Initial download of the metrics may take a while.