Fig. 5
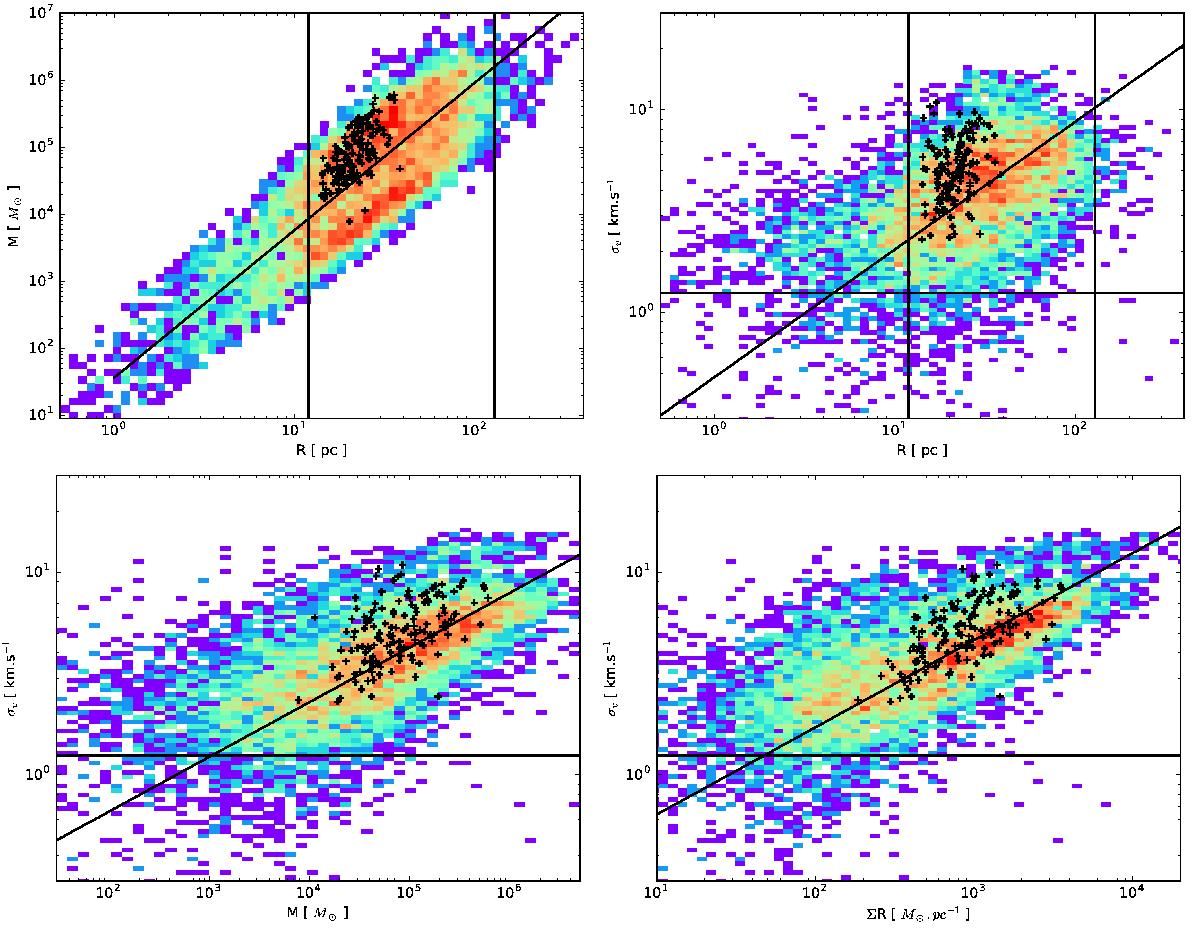
Plot of the Larson’s relations for the giant molecular clouds (black points). The top row shows the M−R (left) and σ−R (right) relations. The bottom row shows the σ−M (left) and σ−ΣR (right) relations. We also plot the 2D histograms and the best fitting relations (colour scale and black line) for the molecular clouds in the Milky Way (Miville-Deschênes et al. 2017). The molecular clouds in the northern filaments of Centaurus A are consistent with those of the Milky Way. We also indicate the limits on the radius and velocity dispersion that can be reached owing to resolution or filtering effects (18.1 ≤ R ≤ 260pc, σv> 1.25km s-1; horizontal and vertical black lines).


Current usage metrics show cumulative count of Article Views (full-text article views including HTML views, PDF and ePub downloads, according to the available data) and Abstracts Views on Vision4Press platform.
Data correspond to usage on the plateform after 2015. The current usage metrics is available 48-96 hours after online publication and is updated daily on week days.
Initial download of the metrics may take a while.