Fig. 3
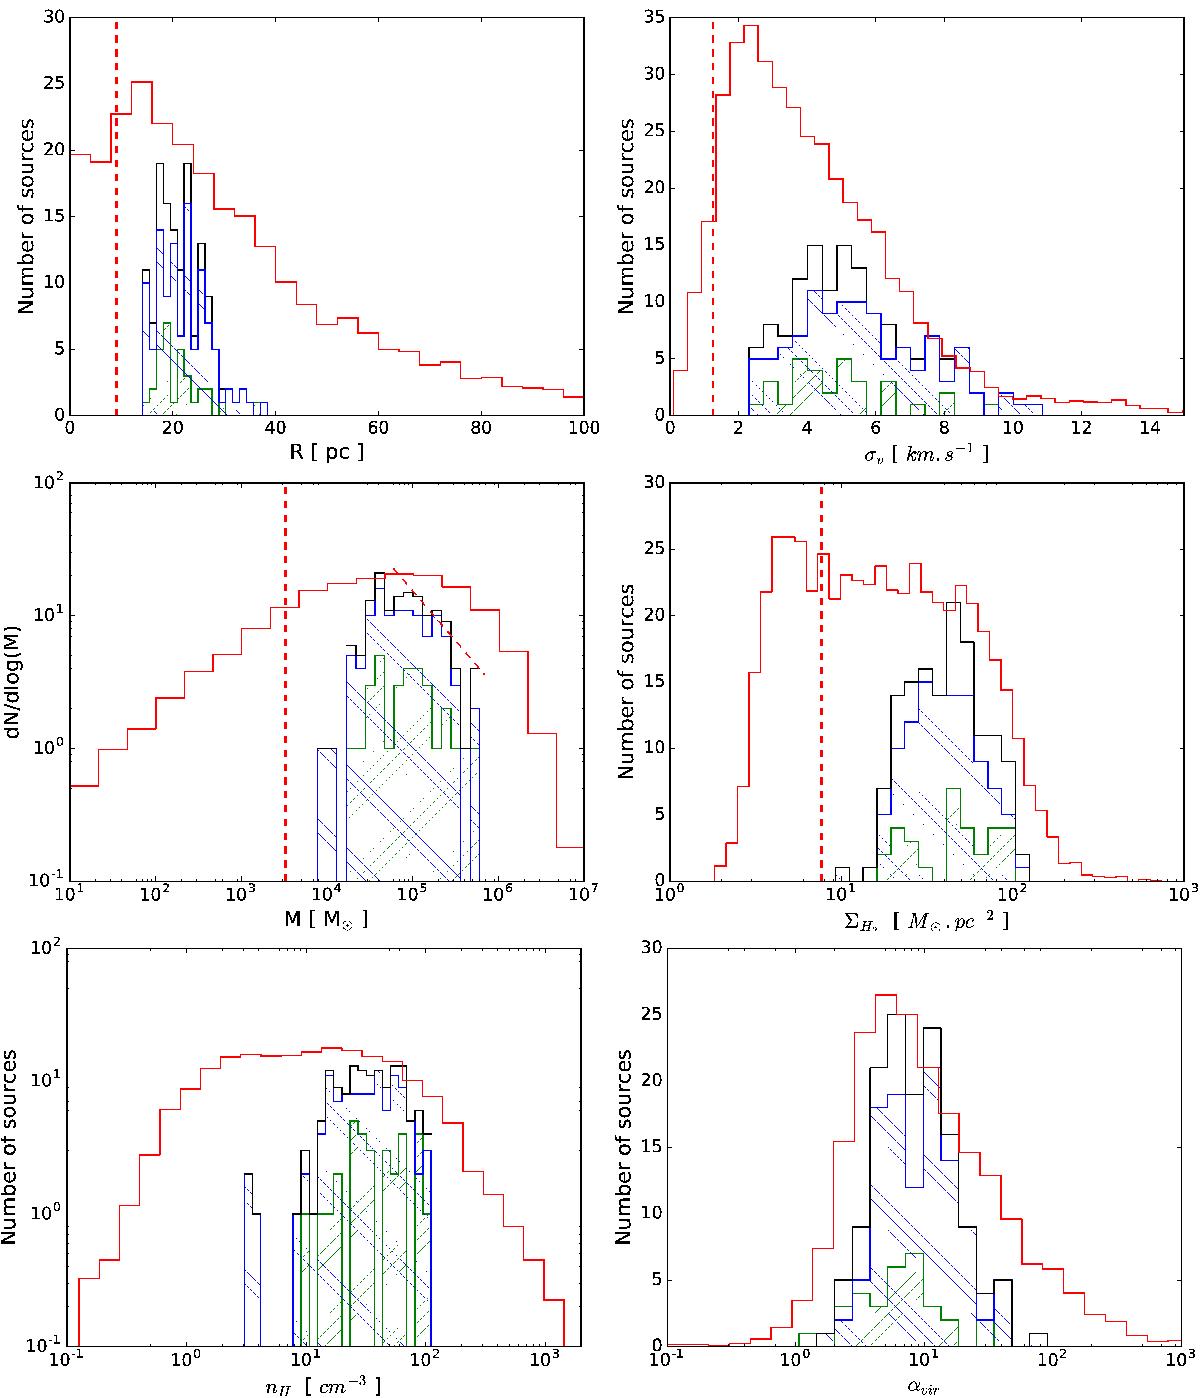
Histogram of the properties of the giant molecular clouds. Top: characteristic radius and velocity dispersion. Middle: molecular gas mass and surface density. The red dashed line in the left plot is the best fitting power law for masses M ≥ 9 × 10⁴M⊙. Bottom: volume density and virial parameter. The vertical red dashed lines correspond to the lower limits due to resolution or sensitivity. In the six plots, we added the histograms of GMCs of the Milky Way (Miville-Deschênes et al. 2017). The clouds were separated in two groups: (i) the Horseshoe complex in blue, where gas is excited by shocks; and (ii) the star-forming clouds in green, associated with Hα, FUV emission, and young stellar clusters.
Current usage metrics show cumulative count of Article Views (full-text article views including HTML views, PDF and ePub downloads, according to the available data) and Abstracts Views on Vision4Press platform.
Data correspond to usage on the plateform after 2015. The current usage metrics is available 48-96 hours after online publication and is updated daily on week days.
Initial download of the metrics may take a while.