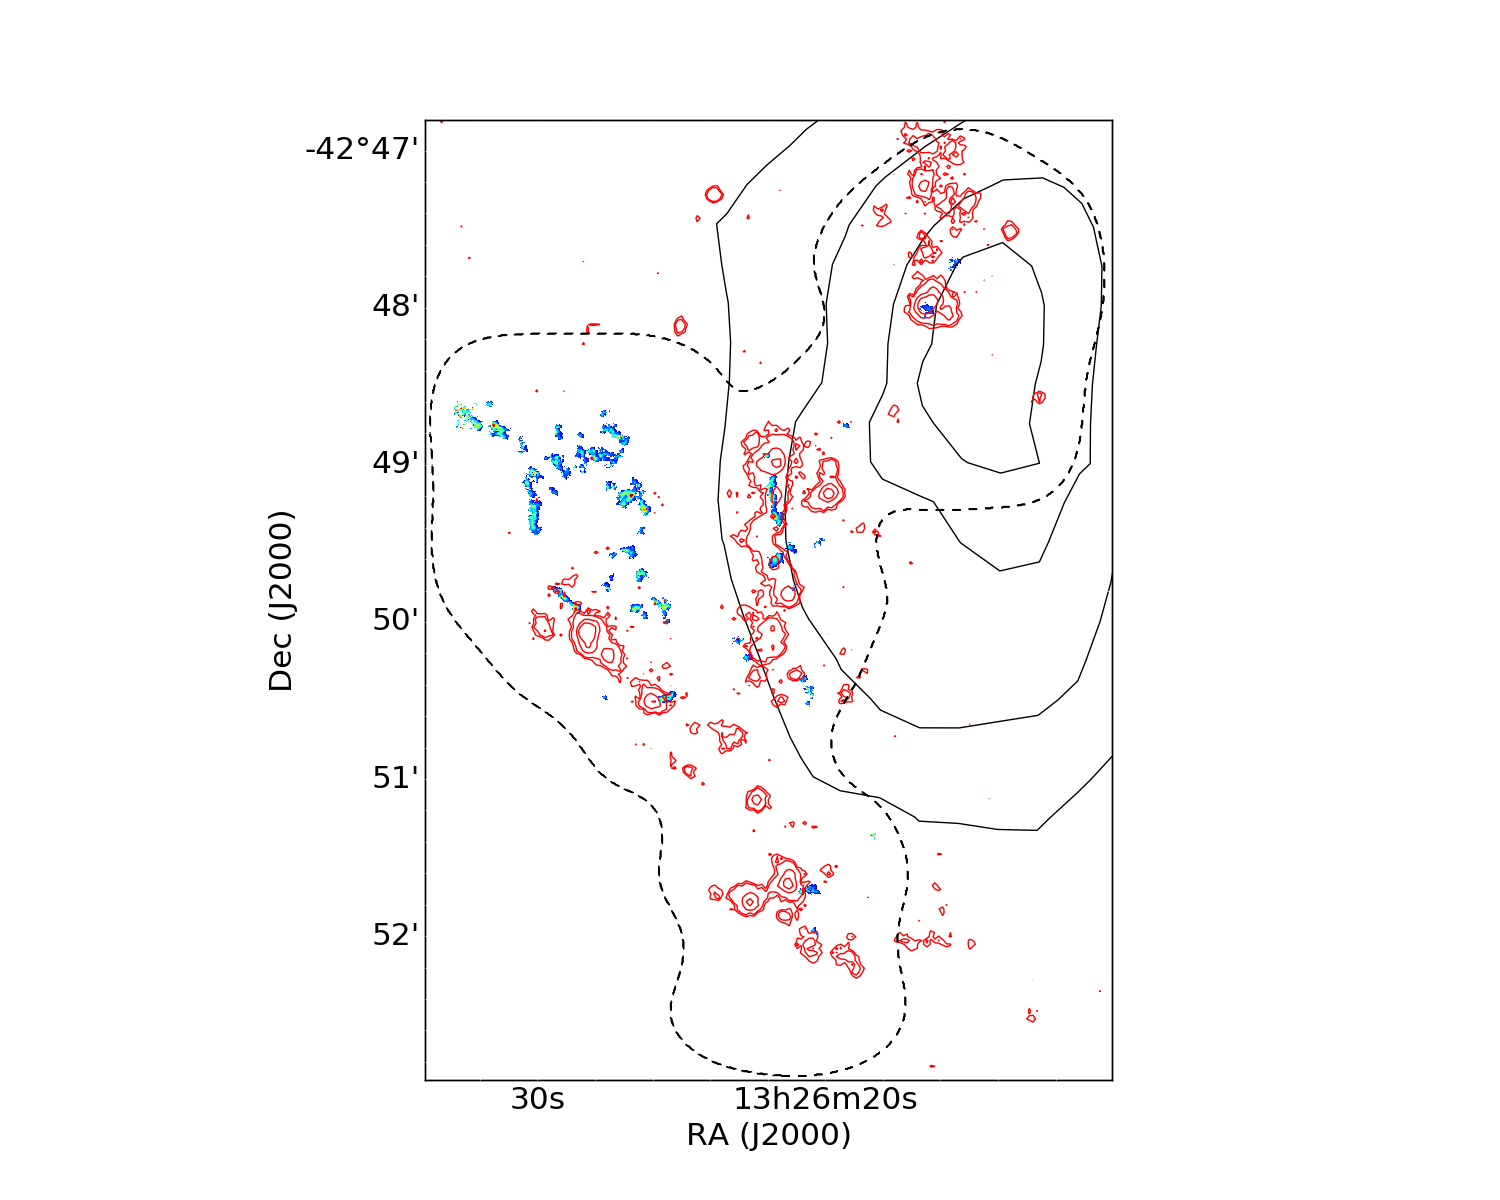
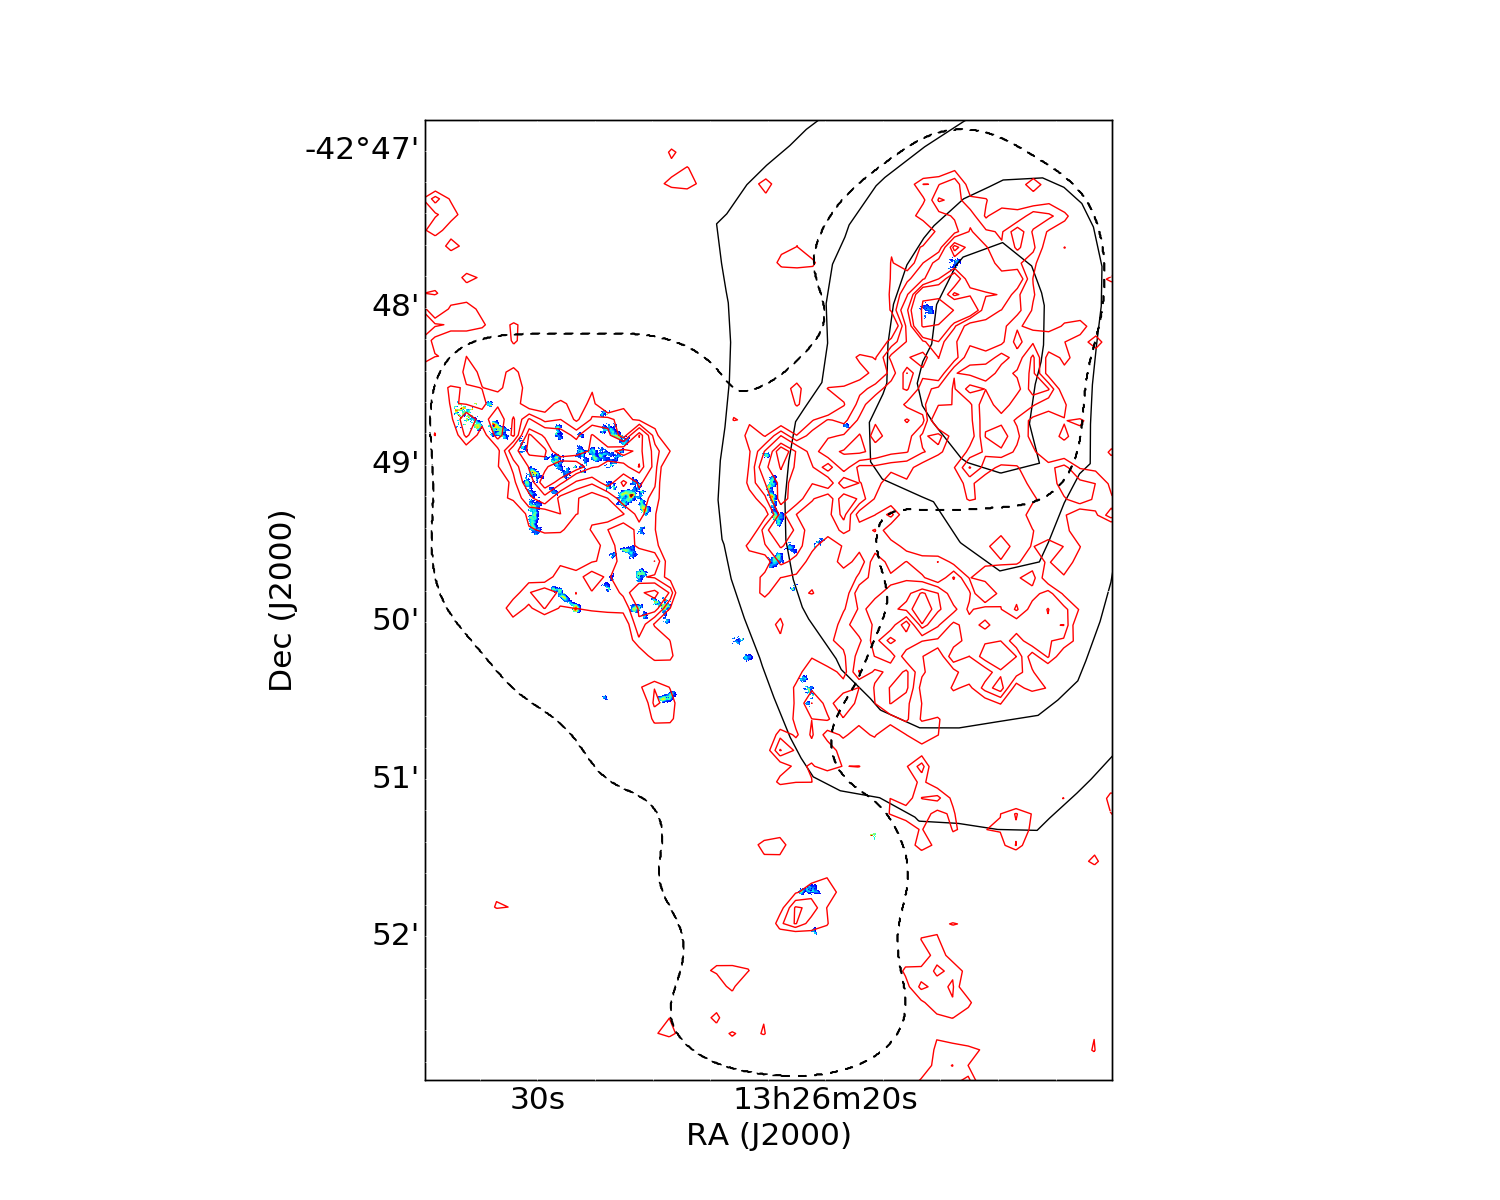
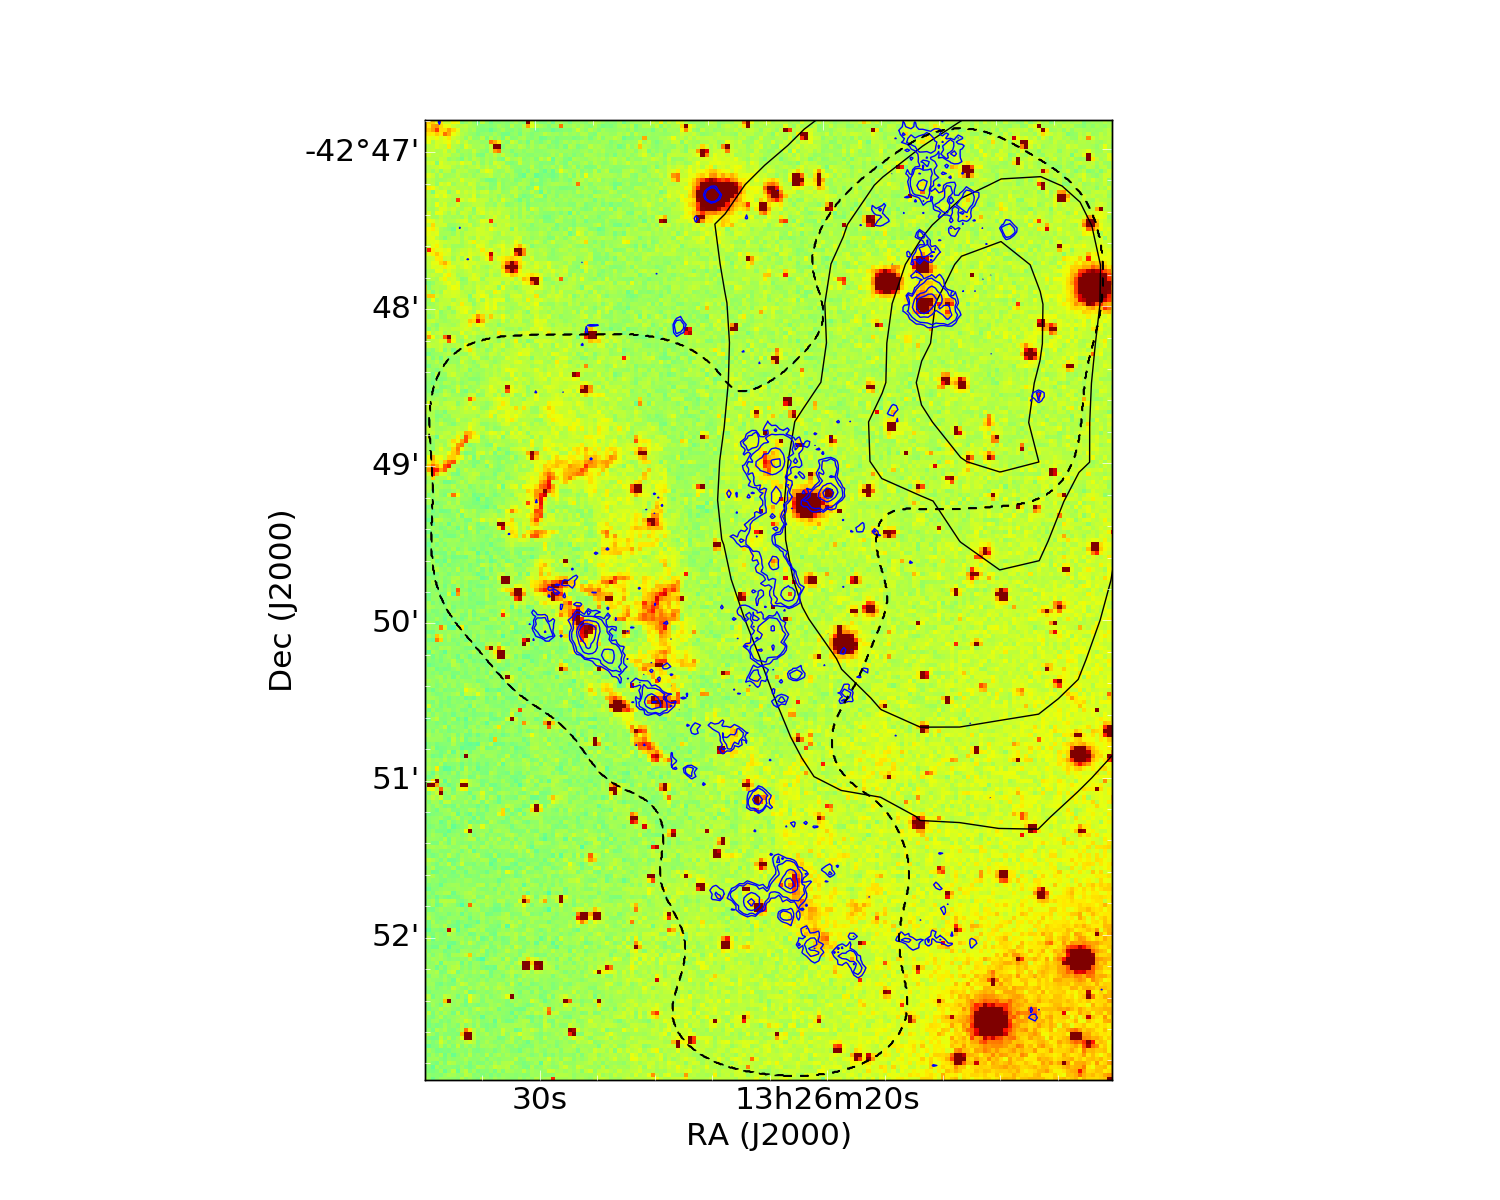
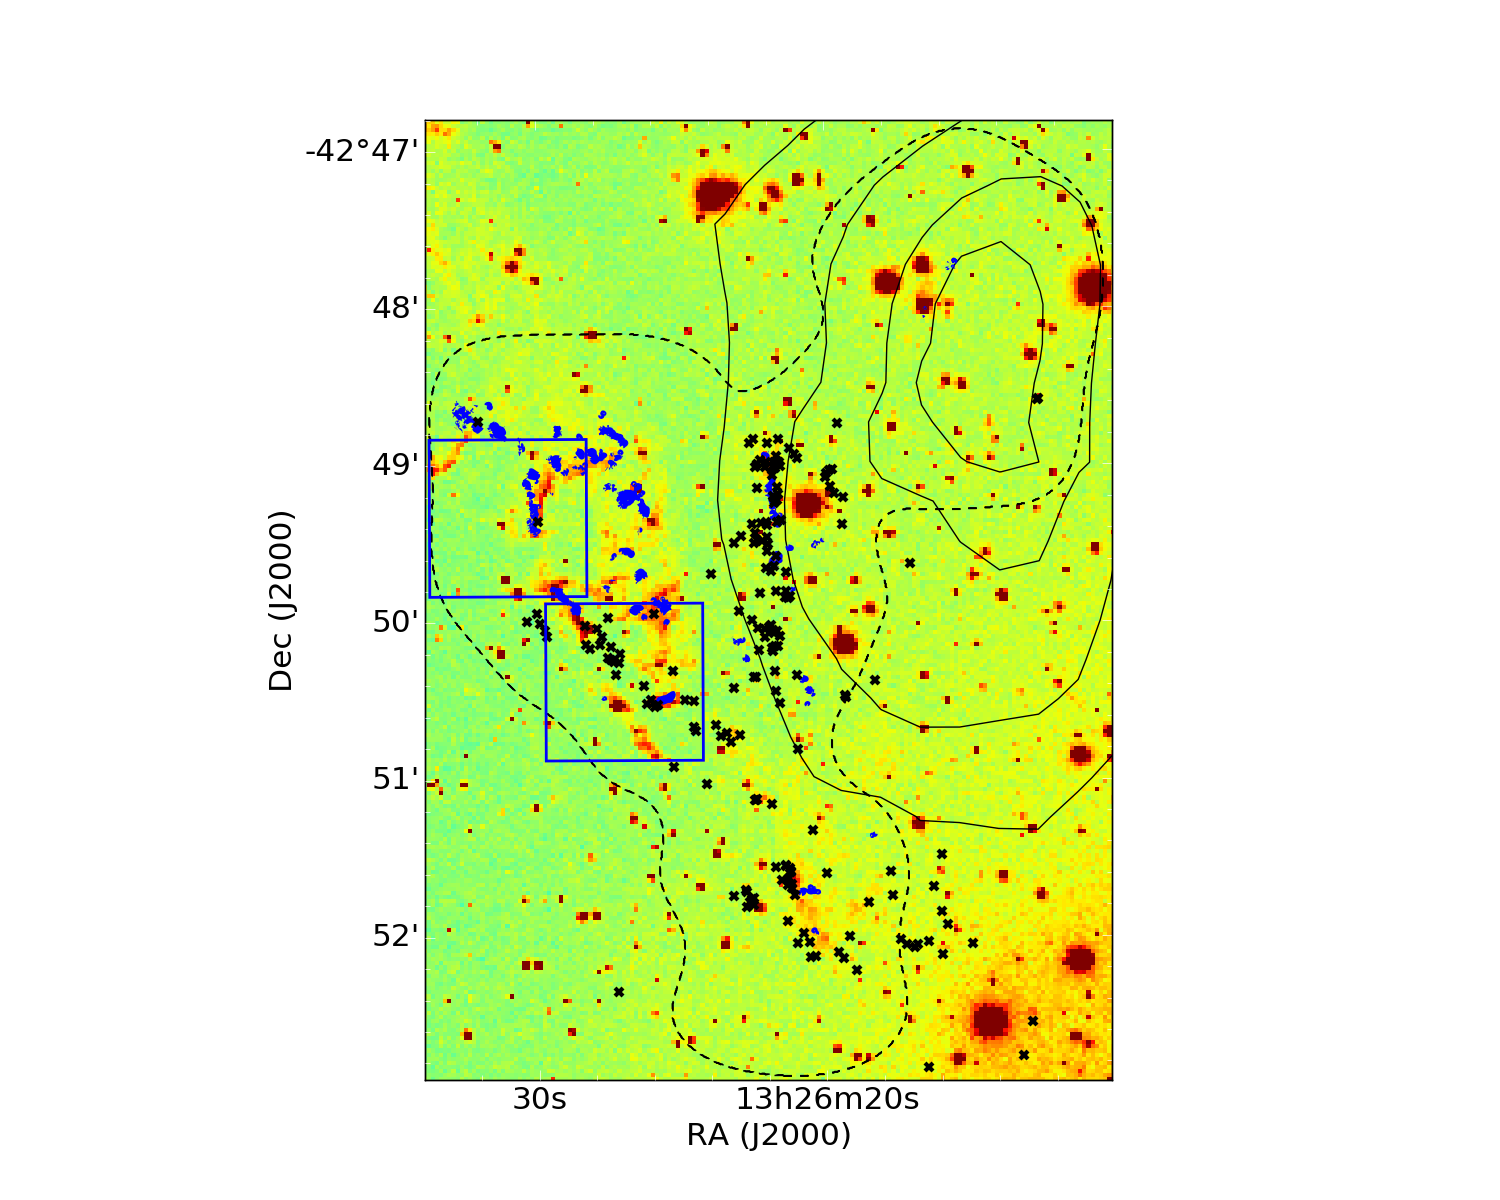
Fig. 2
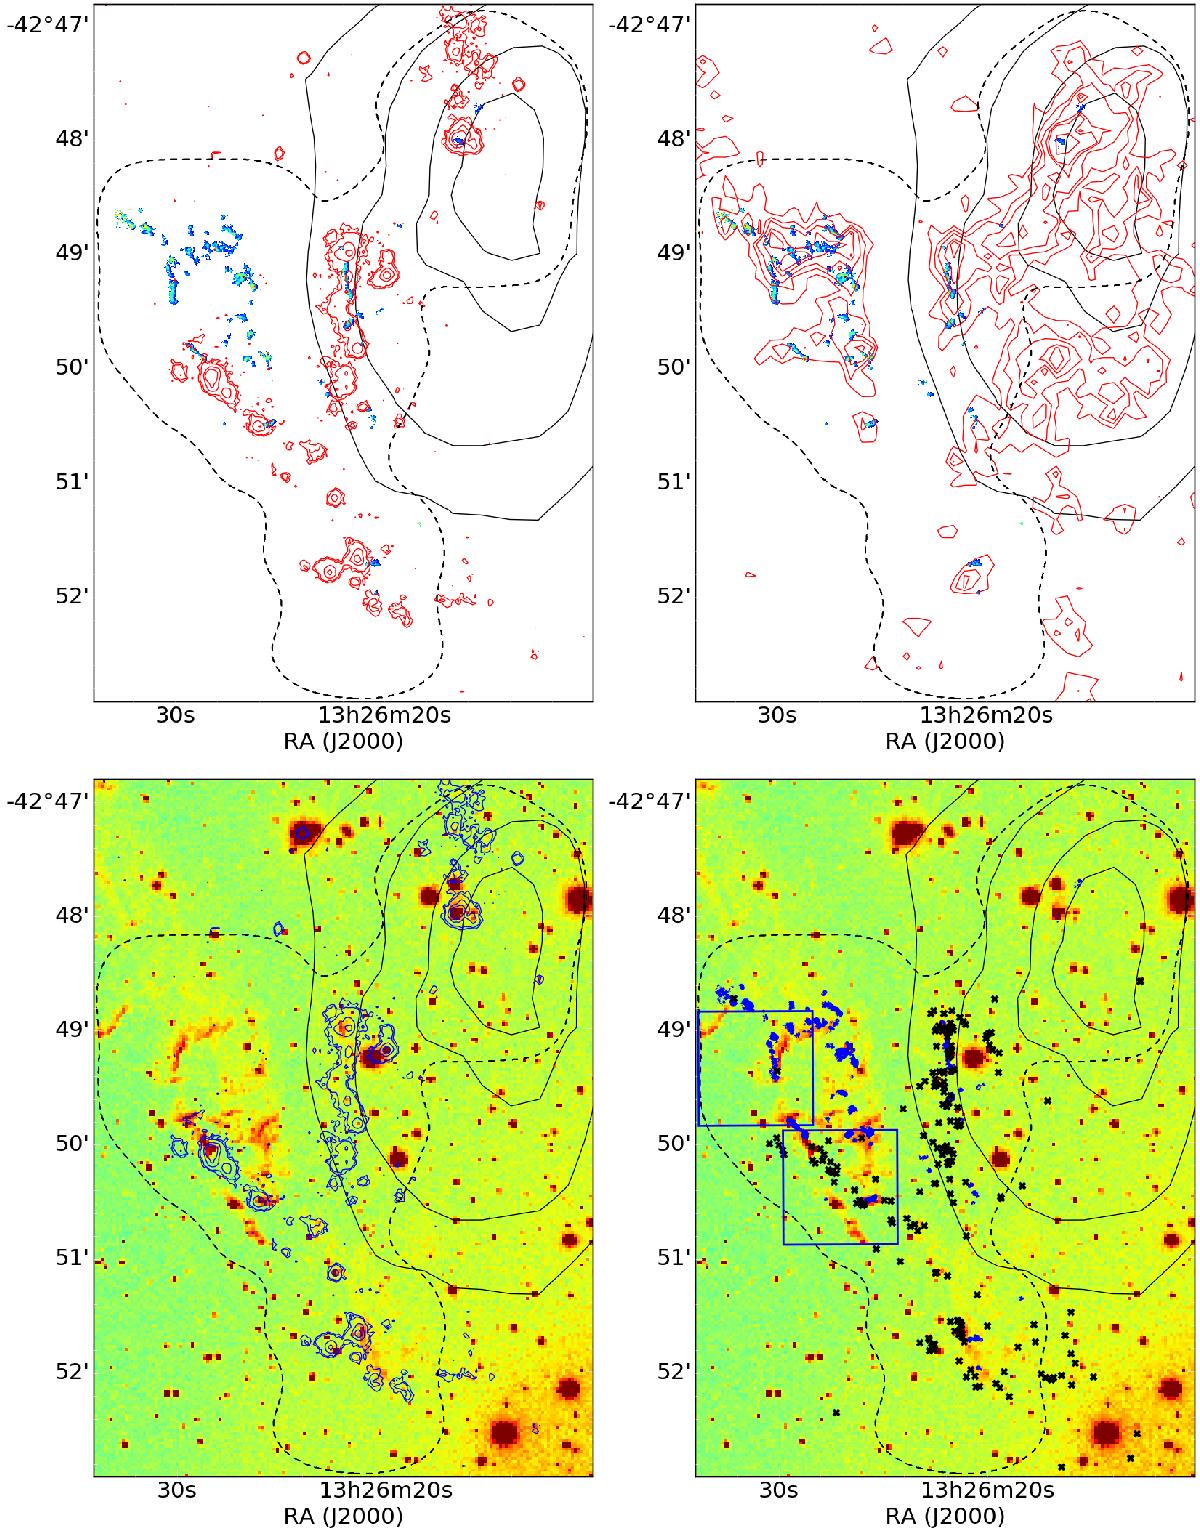
Distribution of the ALMA CO(1–0) emission in relation to star formation regions. Top: CO intensity map with contours of the GALEX FUV (left – Neff et al. 2015a) and Herschel FIR (right) emission. Bottom: the colour map represents the Hα emission seen with CTIO. In all four images, the black contours represent the HI emission and the black dashed line corresponds to the area observed with ALMA. The crosses on the bottom right image indicate the position of the young star clusters from Rejkuba et al. (2001). The Horseshoe complex, which corresponds to the bright CO emission from Salomé et al. (2016a), is not associated with young stellar clusters. In contrast, the Vertical filament (at the edge of the HI shell) is associated with Hα, FUV emission, and young stellar clusters (Rejkuba et al. 2001), and is likely forming stars. It is not established whether the northern FUV emission is associated with young stars as it was not included in Rejkuba et al. (2001).

Current usage metrics show cumulative count of Article Views (full-text article views including HTML views, PDF and ePub downloads, according to the available data) and Abstracts Views on Vision4Press platform.
Data correspond to usage on the plateform after 2015. The current usage metrics is available 48-96 hours after online publication and is updated daily on week days.
Initial download of the metrics may take a while.