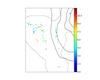
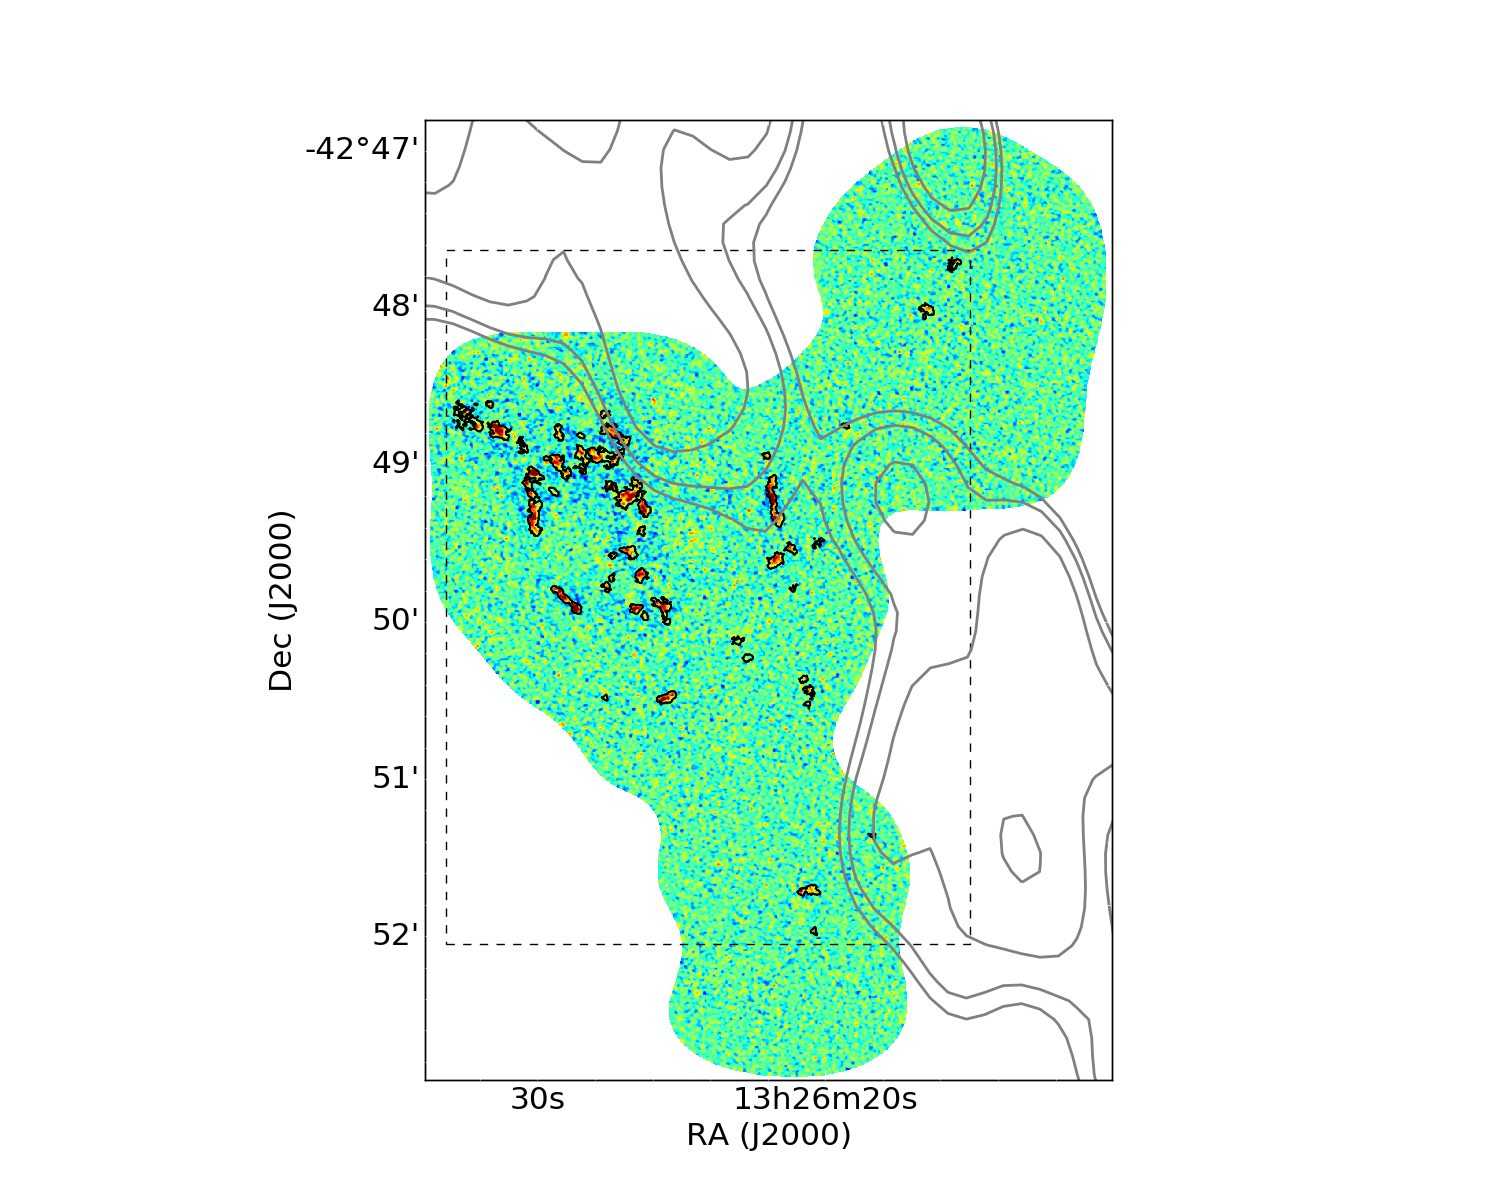
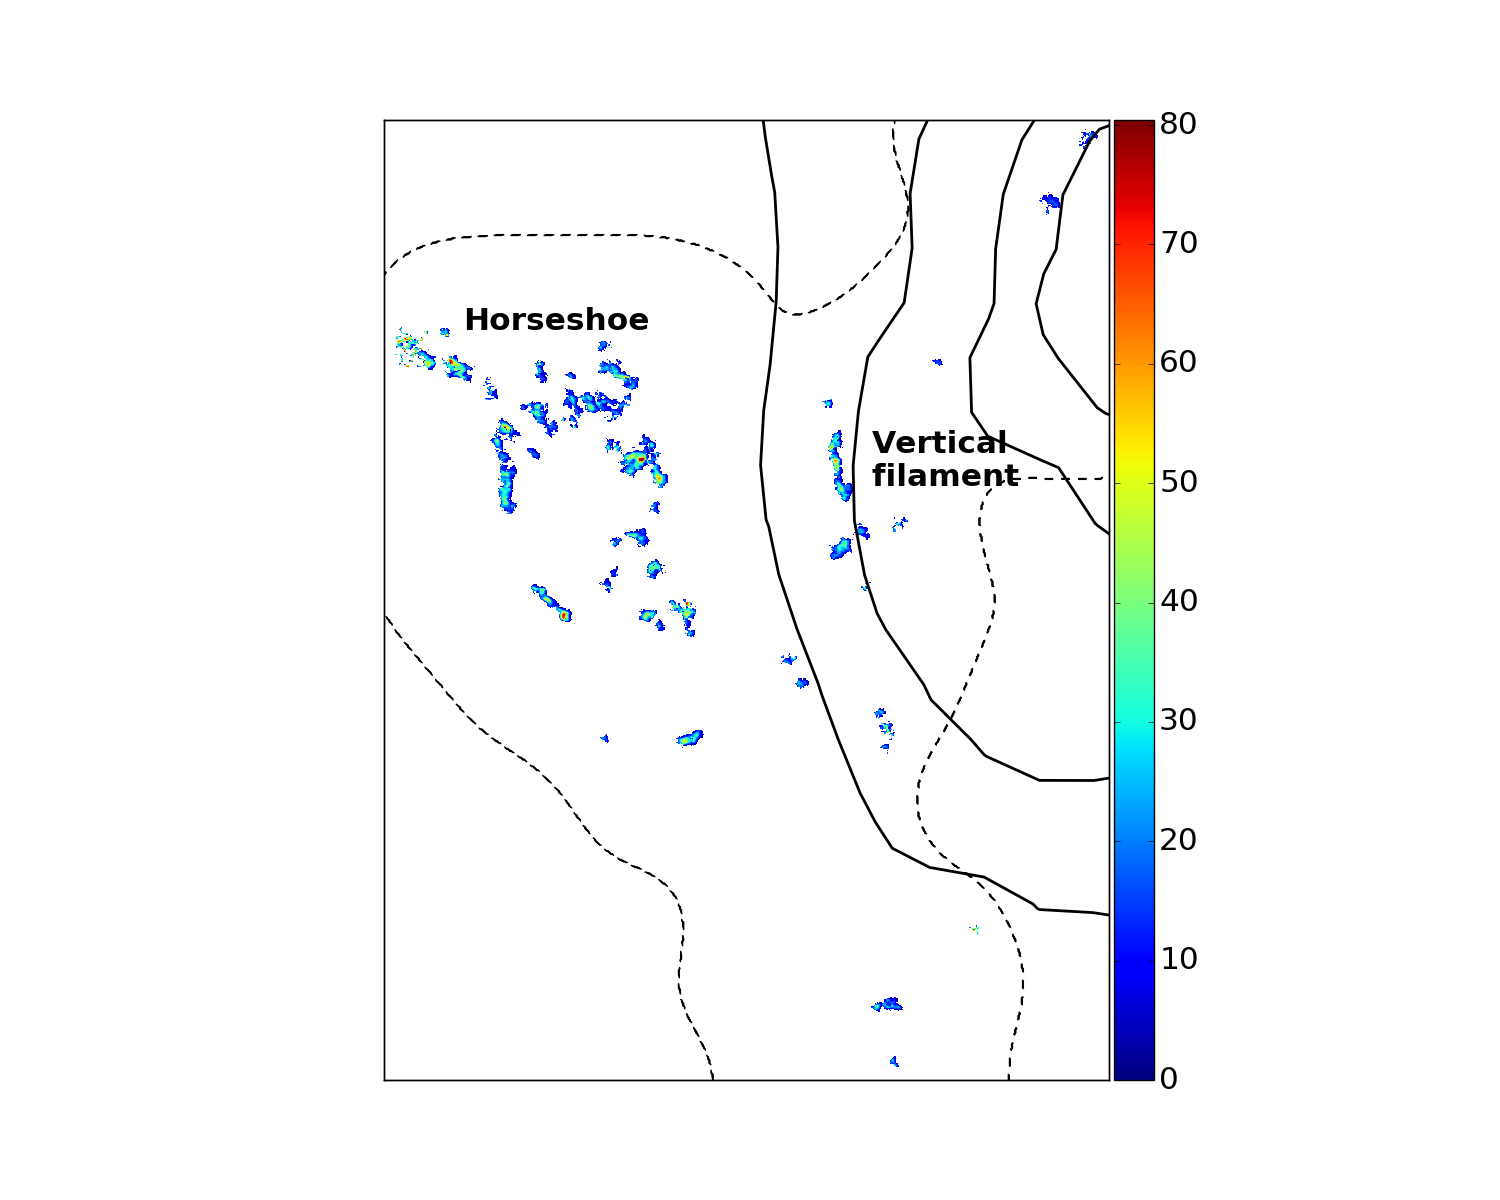
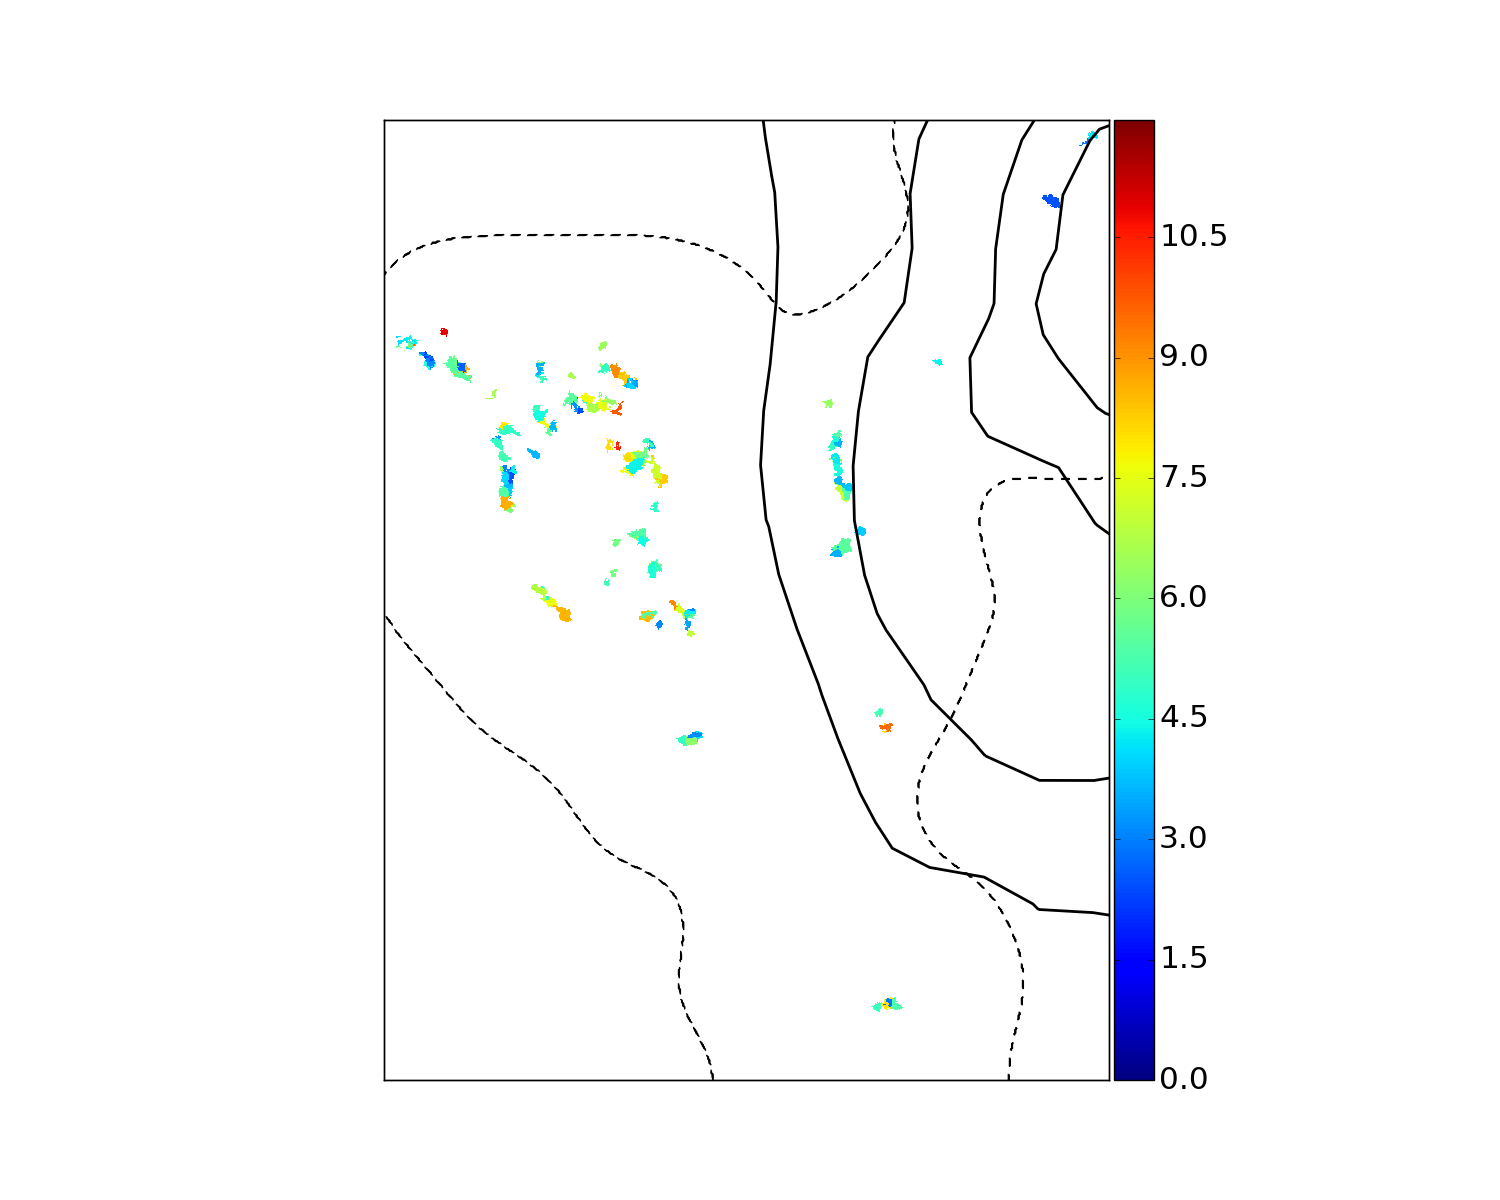
Fig. 1
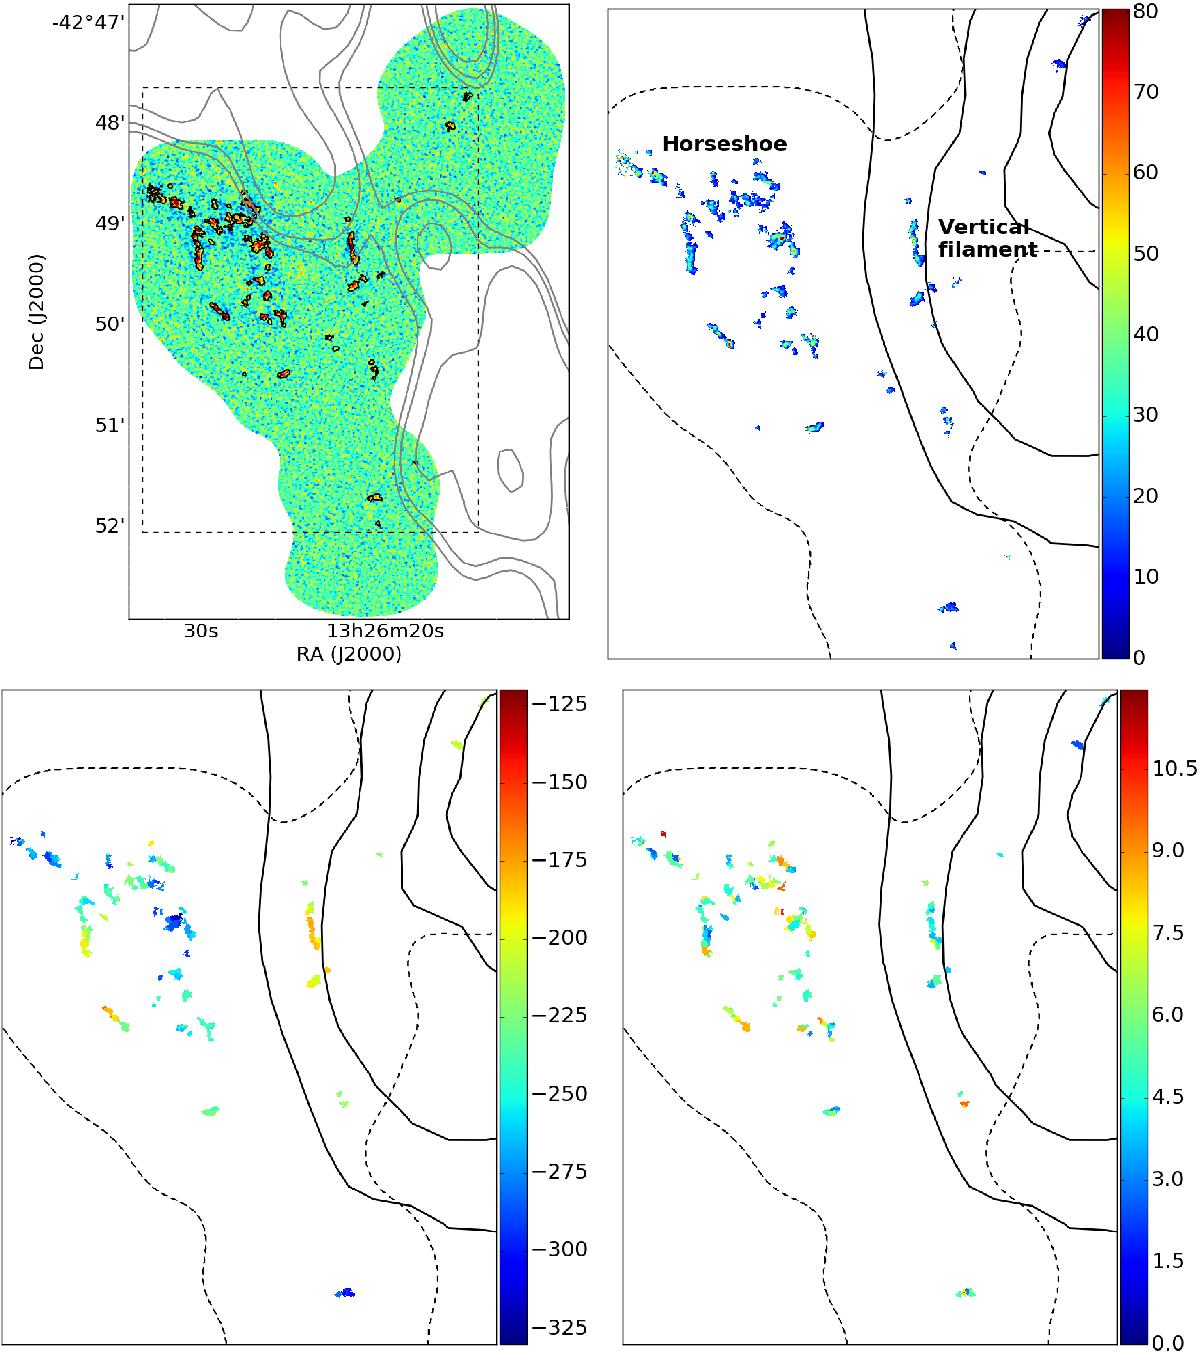
Top left: map of the moment 0 of the ALMA data produced with CASA. We reported, in black contours, the structures extracted by the method presented in Sect. 2.2. We indicate the location of the radio jet in grey contours. Top right: integrated CO intensity map in mJy km s-1 of the molecular clouds seen in CO(1–0) with ALMA. Bottom: maps of the central velocity relative to Centaurus A (left) and velocity dispersion (right) in km s-1 of the clouds. The area of the three maps corresponds to the dashed box in the moment 0 map. The full line and dashed contours represent the HI emission (Schiminovich et al. 1994) and the region observed with ALMA, respectively. The CO emission is clumpy and covers only a small fraction of the region mapped with ALMA.
Current usage metrics show cumulative count of Article Views (full-text article views including HTML views, PDF and ePub downloads, according to the available data) and Abstracts Views on Vision4Press platform.
Data correspond to usage on the plateform after 2015. The current usage metrics is available 48-96 hours after online publication and is updated daily on week days.
Initial download of the metrics may take a while.