Fig. 3
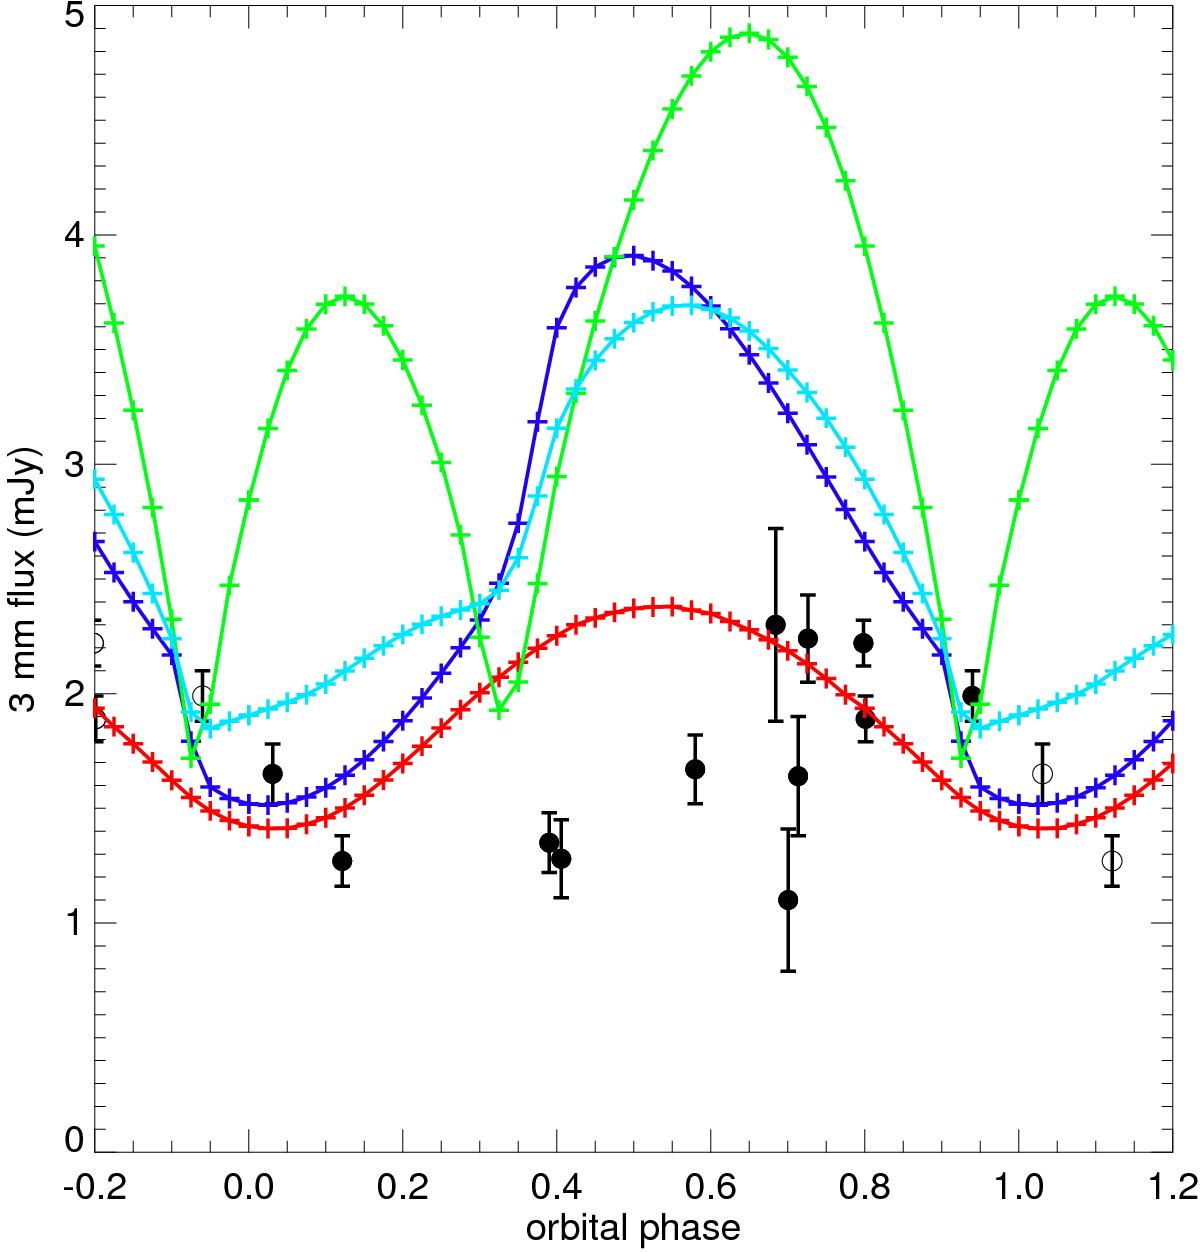
Theoretical fluxes compared to the observed 3 mm fluxes of Cyg OB2 #8A, plotted as a function of orbital phase in the 21.908-day binary period. The black symbols with error bars show the observed data. Open symbols indicate duplications in the extended phase range (as in Fig. 2). The dark blue curve is the synchrotron model, the red curve the adiabatic thermal emission model, the green curve the radiative thermal emission model, and the light blue curve the combined synchrotron and adiabatic thermal emission model.
Current usage metrics show cumulative count of Article Views (full-text article views including HTML views, PDF and ePub downloads, according to the available data) and Abstracts Views on Vision4Press platform.
Data correspond to usage on the plateform after 2015. The current usage metrics is available 48-96 hours after online publication and is updated daily on week days.
Initial download of the metrics may take a while.