Fig. 2
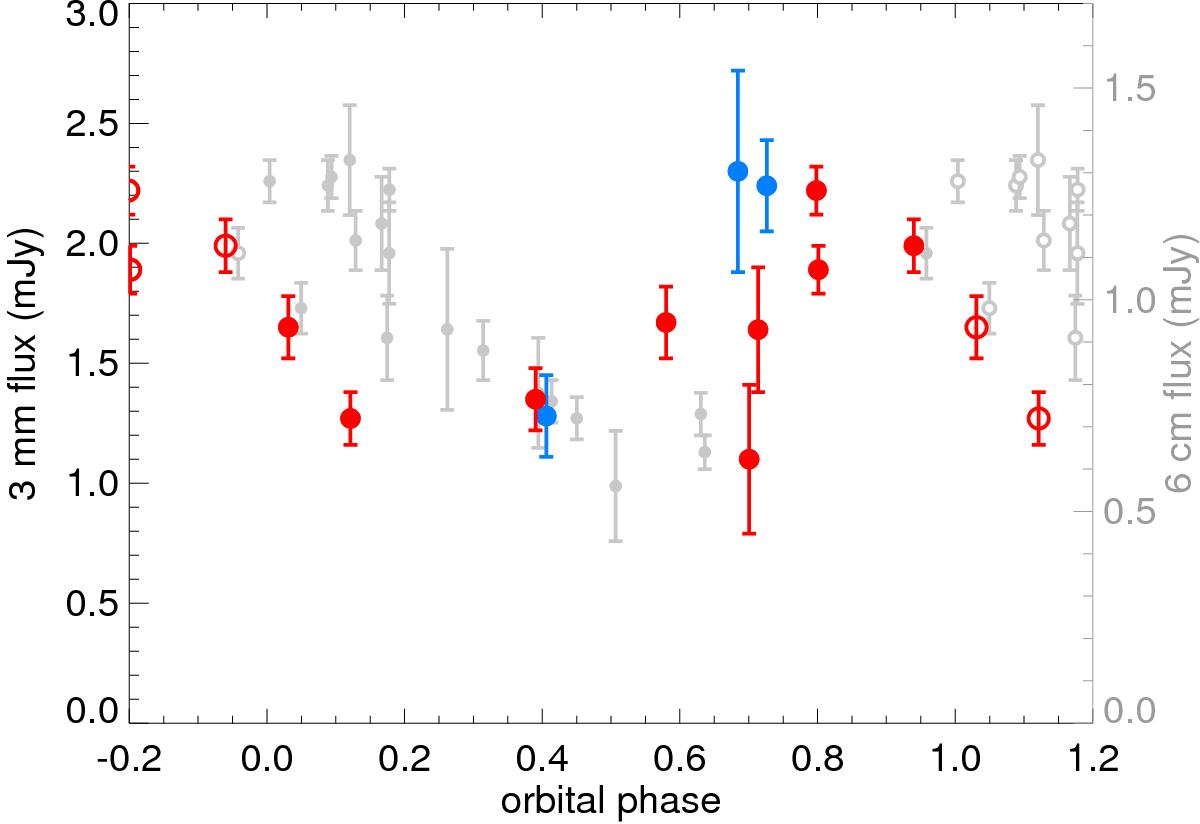
Observed 3 mm fluxes of Cyg OB2 #8A, plotted as a function of orbital phase in the 21.908-day binary period. The blue symbols show the 2014 data, the red ones the 2016 data. To better show the behaviour of the light curve, the phase range is extended by 0.2 on each side. Open symbols indicate duplications in that extended range. The grey data show the 6 cm observations from Blomme et al. (2010). Note that the 3 mm flux scale (left) is different from the 6 cm one (right).
Current usage metrics show cumulative count of Article Views (full-text article views including HTML views, PDF and ePub downloads, according to the available data) and Abstracts Views on Vision4Press platform.
Data correspond to usage on the plateform after 2015. The current usage metrics is available 48-96 hours after online publication and is updated daily on week days.
Initial download of the metrics may take a while.