Fig. 1
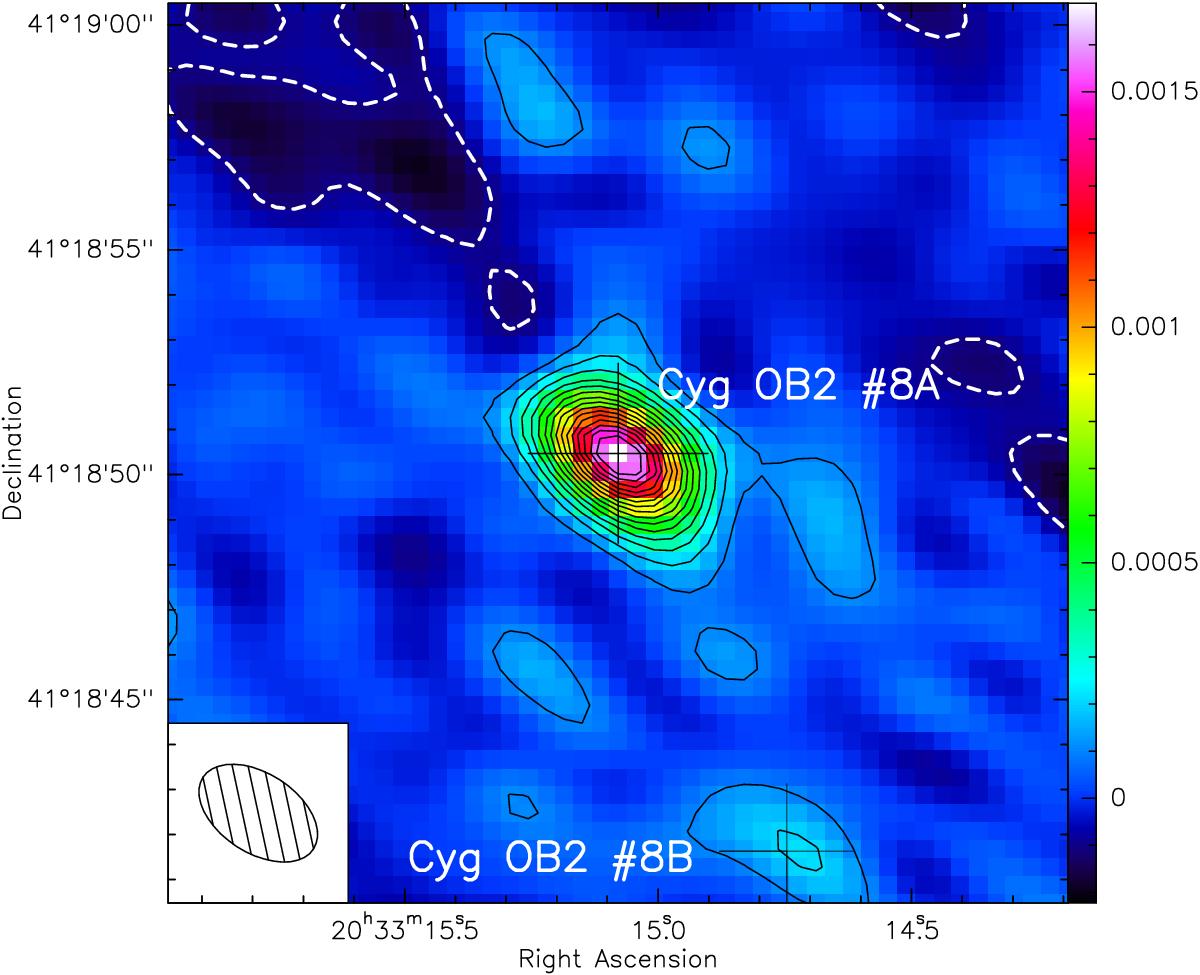
Deep 3 mm image of all Cyg OB2 #8A data combined. The colour scale values are in Jy. The contour levels are at −0.1 mJy, + 0.1 mJy and then go up in steps of 0.1 mJy to 1.6 mJy. The negative contour is indicated by the dashed, white line. The crosses indicate the positions of Cyg OB2 #8A and #8B (from SIMBAD). The synthesized beam (shown in the lower left corner) is 2.93″ × 1.76″ with a position angle of 57.̊1.
Current usage metrics show cumulative count of Article Views (full-text article views including HTML views, PDF and ePub downloads, according to the available data) and Abstracts Views on Vision4Press platform.
Data correspond to usage on the plateform after 2015. The current usage metrics is available 48-96 hours after online publication and is updated daily on week days.
Initial download of the metrics may take a while.