Fig. 6
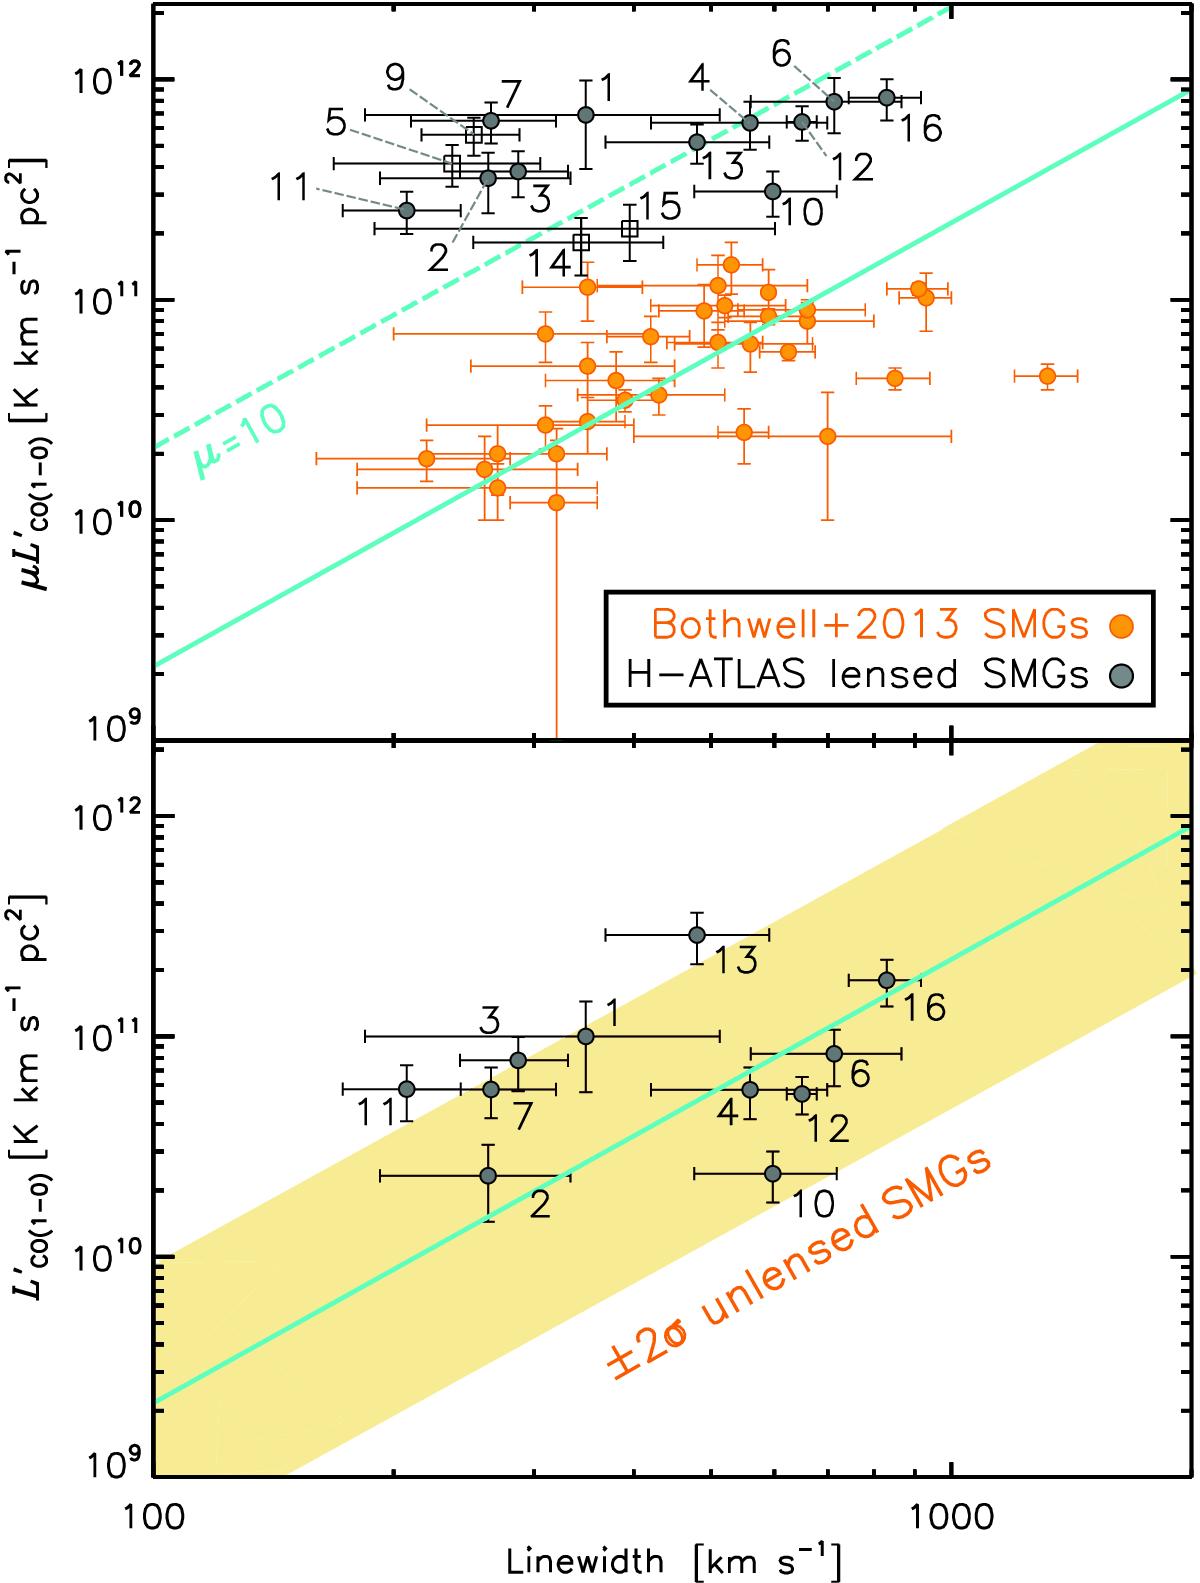
Upper panel: μ![]() plotted against CO linewidth. Orange data points represent the unlensed SMGs from Bo13, while grey data points (indexed as in Table 2) are from this work, for which the filled circles show the sources with existing lensing model and the black open squares are the ones without lensing models. The solid turquoise line shows the fit proposed by Bo13 for the relation of
plotted against CO linewidth. Orange data points represent the unlensed SMGs from Bo13, while grey data points (indexed as in Table 2) are from this work, for which the filled circles show the sources with existing lensing model and the black open squares are the ones without lensing models. The solid turquoise line shows the fit proposed by Bo13 for the relation of ![]() vs. linewidth as
vs. linewidth as ![]() ∝
∝ ![]() . The dashed turquoise line indicates the positions for μ = 10 assuming this relation. As shown in the plot, the magnification factors of G12v2.43 (#5) and NAv1.177 (#9) are likely to be large. Lower panel: intrinsic
. The dashed turquoise line indicates the positions for μ = 10 assuming this relation. As shown in the plot, the magnification factors of G12v2.43 (#5) and NAv1.177 (#9) are likely to be large. Lower panel: intrinsic ![]() plotted against the CO linewidth. The light orange region shows the ±2σ range of the scatter derived from the SMGs of Bo13. Our sources generally agree with the correlation.
plotted against the CO linewidth. The light orange region shows the ±2σ range of the scatter derived from the SMGs of Bo13. Our sources generally agree with the correlation.
Current usage metrics show cumulative count of Article Views (full-text article views including HTML views, PDF and ePub downloads, according to the available data) and Abstracts Views on Vision4Press platform.
Data correspond to usage on the plateform after 2015. The current usage metrics is available 48-96 hours after online publication and is updated daily on week days.
Initial download of the metrics may take a while.