Fig. 5
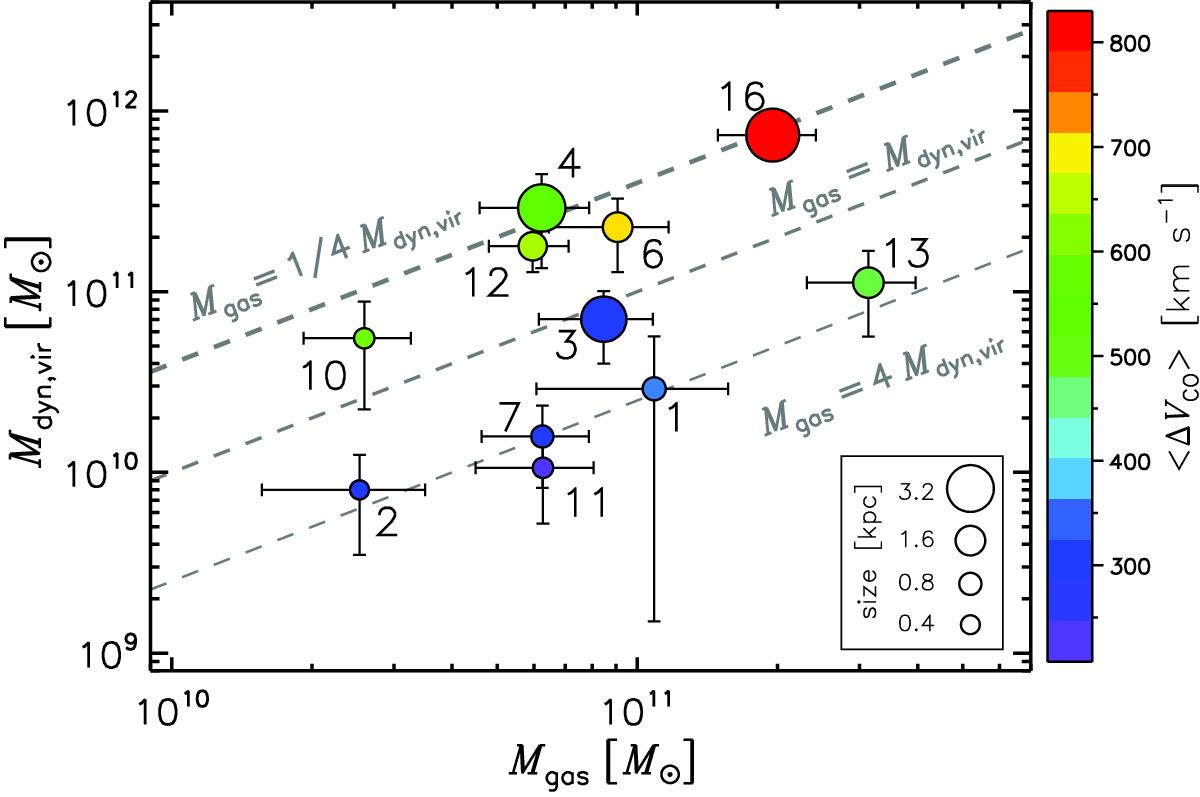
A comparison between molecular gas mass and dynamical mass of our H-ATLAS lensed sample. The grey dashed lines indicate the ratio of Mgas /Mdyn,vir. Colours are coded according to the average CO linewidth. The size of the symbol represents the value of rhalf of each source. There is a clear trend that sources with smaller linewidths have large ratios of Mgas /Mdyn,vir. The source index can be found in Fig. 1 and Table B.1.
Current usage metrics show cumulative count of Article Views (full-text article views including HTML views, PDF and ePub downloads, according to the available data) and Abstracts Views on Vision4Press platform.
Data correspond to usage on the plateform after 2015. The current usage metrics is available 48-96 hours after online publication and is updated daily on week days.
Initial download of the metrics may take a while.