Fig. 3
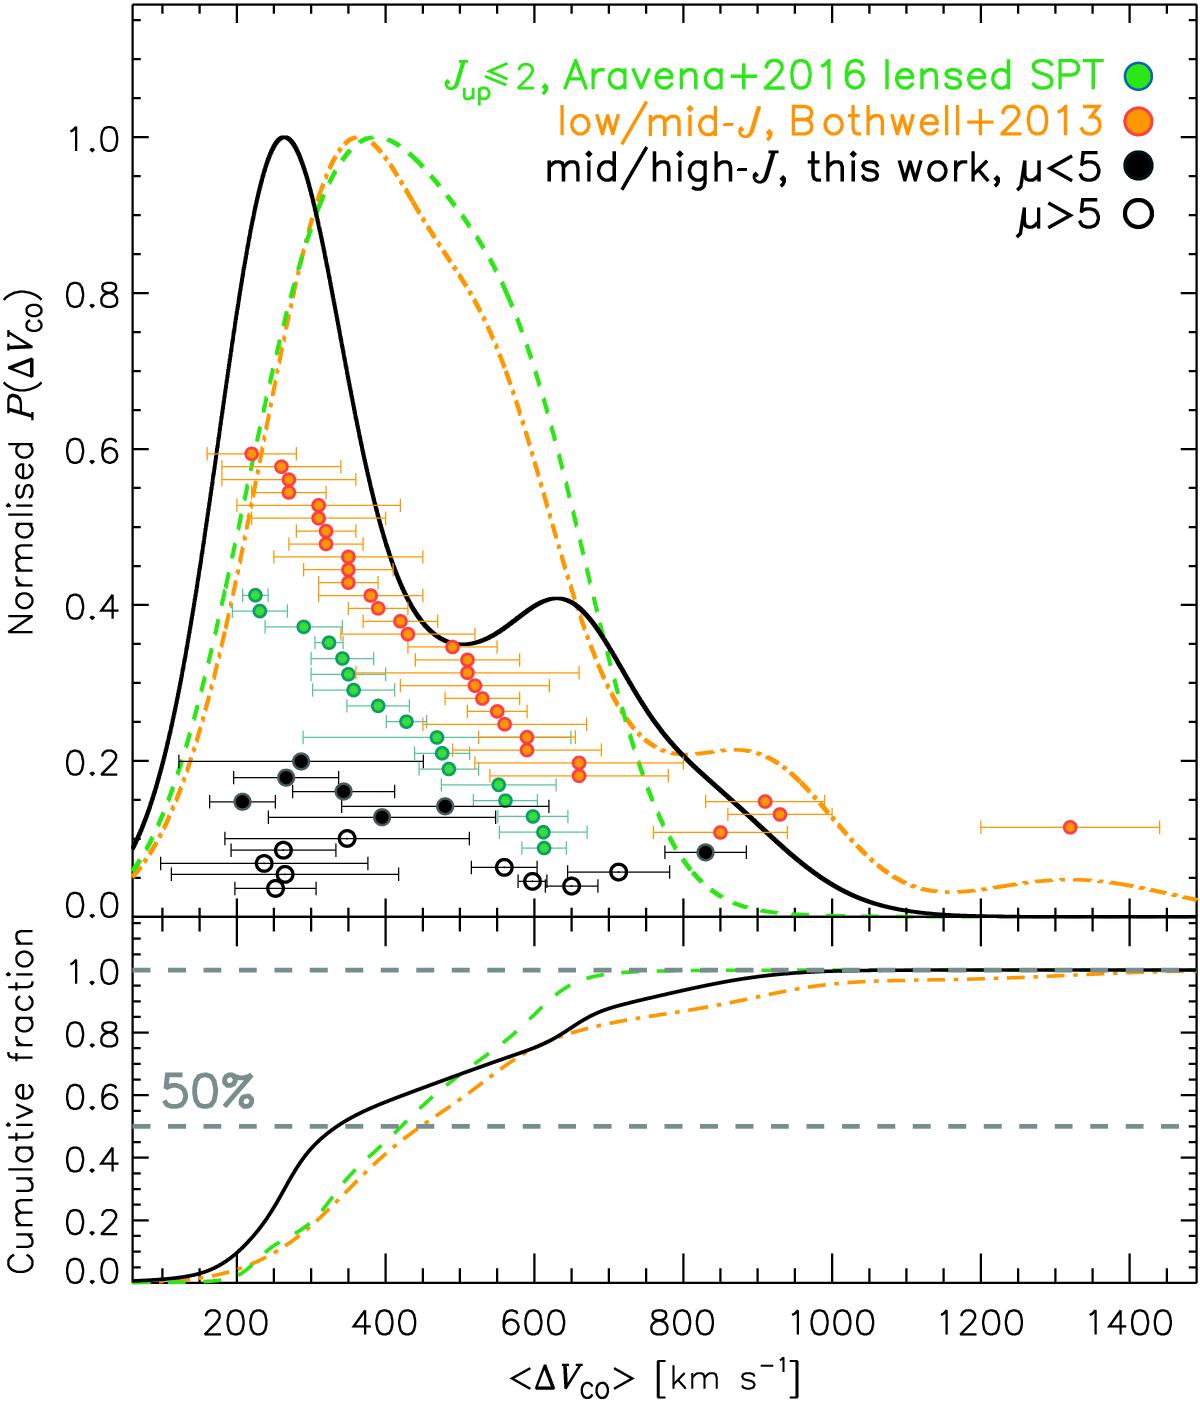
Upper panel: linewidths with errors from three different samples, with probability distributions obtained by adaptive kernel density estimate (Silverman 1986): black symbols and line are from this work, orange symbols and dashed-dotted line are the Jup ≥ 2 CO linewidth distribution in unlensed SMGs (Bo13) and the green symbols and dashed line represent the linewidth from the Jup ≤ 2 CO lines of the lensed SPT sources (Aravena et al. 2016b). Our lensed sources with μ> 5 are indicated with open circles while the other sources are shown in filled circles. We note that although there is no lensing model for G12v2.43 and NAv1.144, it is suggested that their μ are likely to be ~10 (see Sect. 4.2 and Fig. 6). Thus, they are also marked with open circles. Lower panel: cumulative distribution of ⟨ ΔVCO ⟩ for the three samples with the same colour code.
Current usage metrics show cumulative count of Article Views (full-text article views including HTML views, PDF and ePub downloads, according to the available data) and Abstracts Views on Vision4Press platform.
Data correspond to usage on the plateform after 2015. The current usage metrics is available 48-96 hours after online publication and is updated daily on week days.
Initial download of the metrics may take a while.