Fig. 13
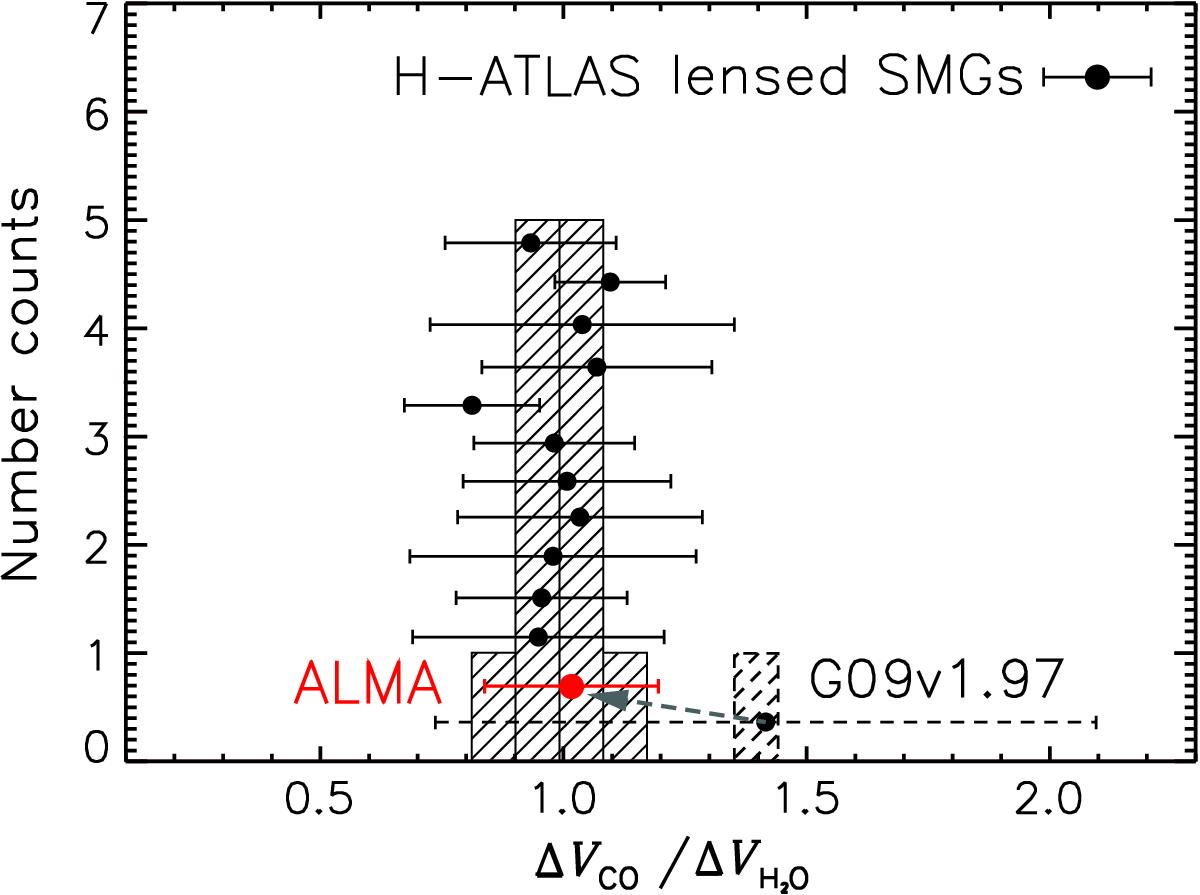
Histogram showing the distribution of the ratio (indicated by black data points) between the linewidths of CO and H2O. The H2O linewidth are from Y16 and O13. It is clear that most of our sources have similar CO and H2O linewidth, with an average ratio of 1.0 ± 0.1. For G09v1.97, the IRAM-30 m spectrum shows that the asymmetric CO line is ~1.5 times larger than that of the H2O line (Y16) as shown by the dashed error bar and histogram. However, using the ALMA high S/N CO and H2O spectral data of G09v1.97 (Yang et al., in prep.), we find a ratio of the linewidth to be very close to 1 as indicated by the red point. The source of SDP 81 is not shown here because it is a special case as discussed in the text.
Current usage metrics show cumulative count of Article Views (full-text article views including HTML views, PDF and ePub downloads, according to the available data) and Abstracts Views on Vision4Press platform.
Data correspond to usage on the plateform after 2015. The current usage metrics is available 48-96 hours after online publication and is updated daily on week days.
Initial download of the metrics may take a while.