Fig. 12
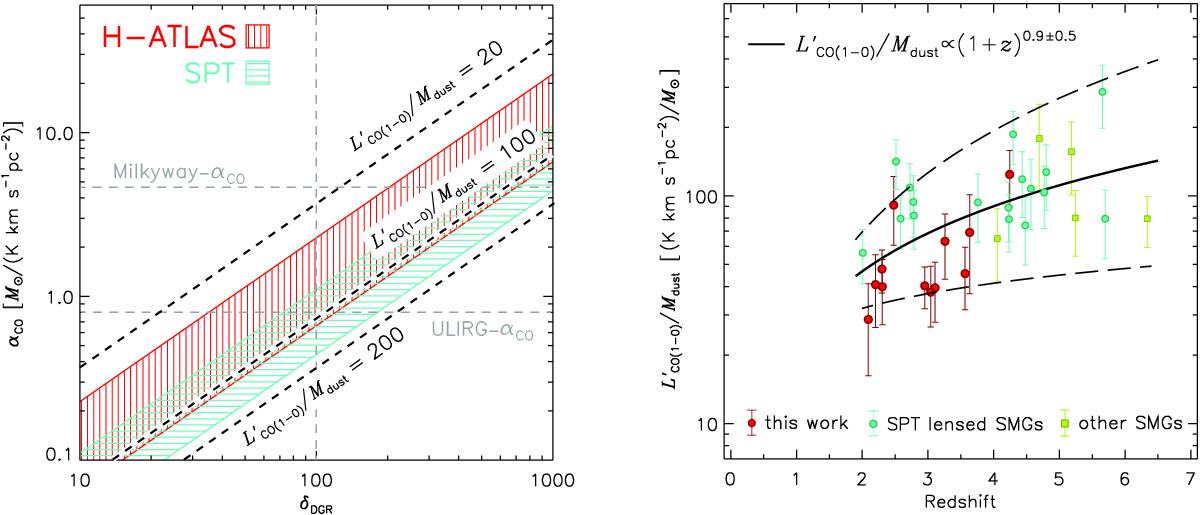
Left panel: the ±1σ range of δGDR and αCO derived from observed Mdust and ![]() using Eq. (10). Red region is from this work while the green region is from Aravena et al. (2016b). Our results generally agree with the SPT sources’ albeit having slightly larger αCO or smaller δGDR. Right panel: the ratio between
using Eq. (10). Red region is from this work while the green region is from Aravena et al. (2016b). Our results generally agree with the SPT sources’ albeit having slightly larger αCO or smaller δGDR. Right panel: the ratio between ![]() and Mdust of SMGs across the different redshifts. The SPT lensed SMGs in green points are from Aravena et al. (2016b), while our sources are in red. We also plot other SMGs from the literature in yellow filled squares (see references in text). The black line shows a best-fit to all the data points and dashed black lines show the ±1σ ranges (for the slope only) from the fit. The resulting relation is shown in the legend.
and Mdust of SMGs across the different redshifts. The SPT lensed SMGs in green points are from Aravena et al. (2016b), while our sources are in red. We also plot other SMGs from the literature in yellow filled squares (see references in text). The black line shows a best-fit to all the data points and dashed black lines show the ±1σ ranges (for the slope only) from the fit. The resulting relation is shown in the legend.
Current usage metrics show cumulative count of Article Views (full-text article views including HTML views, PDF and ePub downloads, according to the available data) and Abstracts Views on Vision4Press platform.
Data correspond to usage on the plateform after 2015. The current usage metrics is available 48-96 hours after online publication and is updated daily on week days.
Initial download of the metrics may take a while.