Fig. 11
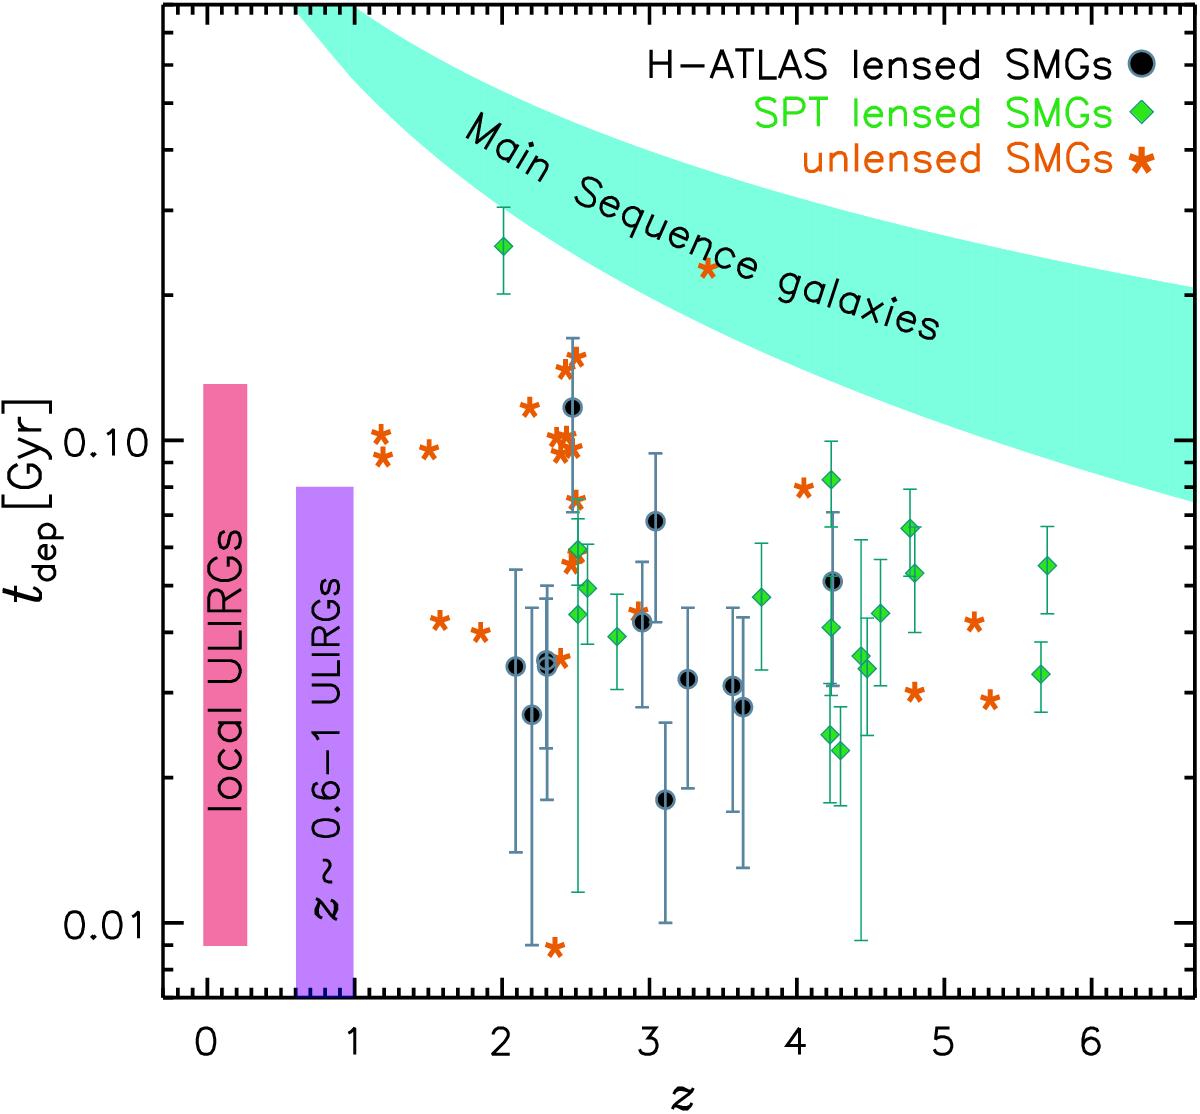
Extended from Fig. 7 of Aravena et al. (2016b): molecular gas depletion time of our lensed SMGs (black circles), SPT lensed SMGs (green diamonds), and other unlensed SMGs (orange stars). The ranges of local ULIRGs (Solomon et al. 1997) and z = 0.6–1 ULIRGs (Combes et al. 2013) are also included as the red and purple regions, respectively. The cyan region indicates the main sequence galaxies as described by Saintonge et al. (2013) through the formula tdep = 1.5(1 + z)α, in which α is from α = −1.5 (Davé et al. 2012) to α = −1.0 (Magnelli et al. 2013).
Current usage metrics show cumulative count of Article Views (full-text article views including HTML views, PDF and ePub downloads, according to the available data) and Abstracts Views on Vision4Press platform.
Data correspond to usage on the plateform after 2015. The current usage metrics is available 48-96 hours after online publication and is updated daily on week days.
Initial download of the metrics may take a while.