Fig. 10
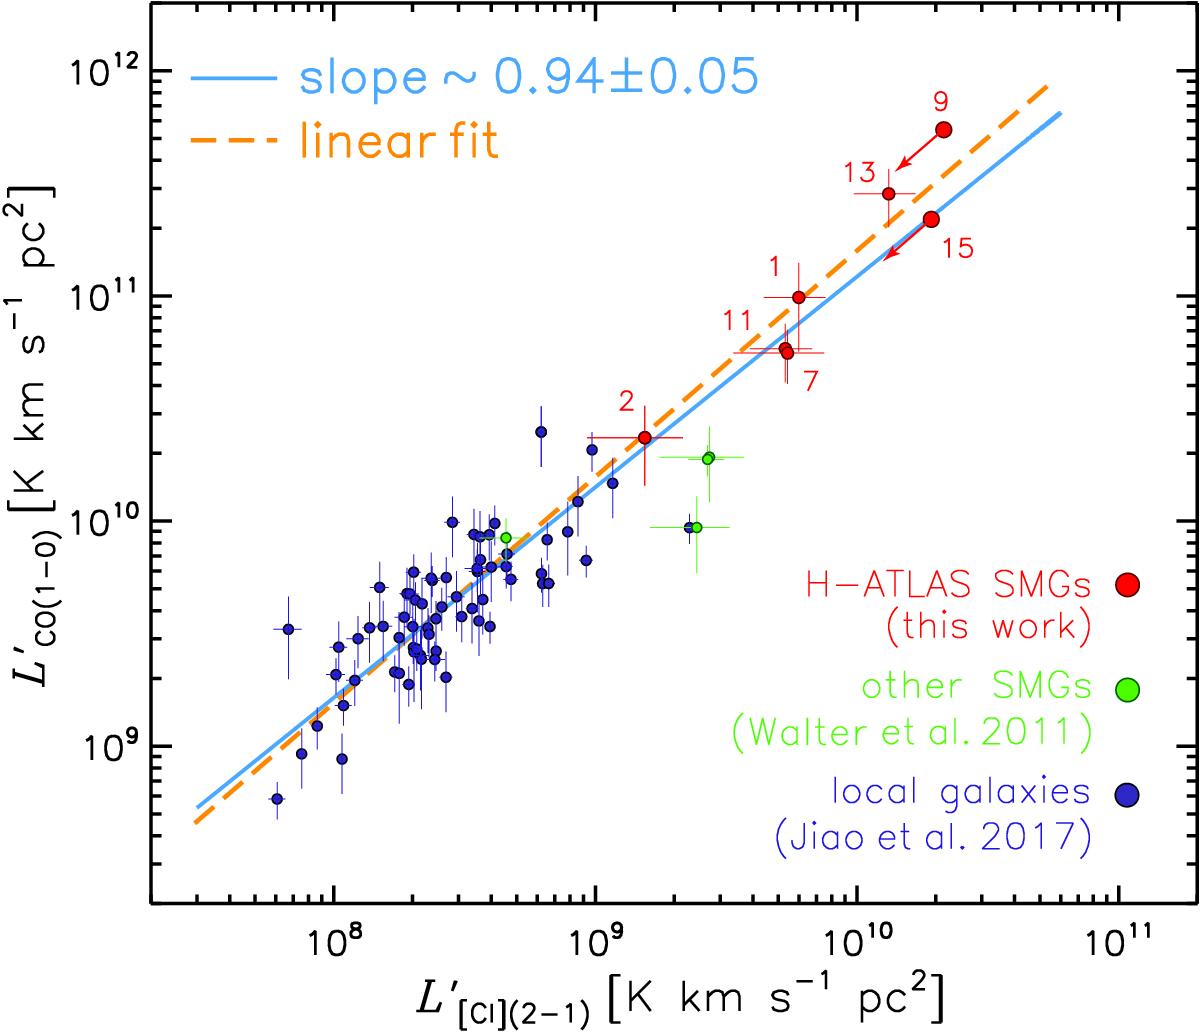
![]() versus
versus ![]() including (U)LIRGs from Jiao et al. (2017; dark purple) H-ATLAS SMGs (red) and other SMGs from Walter et al. (2011; green). Two of our sources, NAv1.177 (#9) and G12v2.257 (#15) are lacking lens modelling, thus we plot the limit, and the arrows show the direction for lensing correction. A fit to the correlation from the local to high-redshift galaxies is indicated by the blue line, with a slope of 0.94 ± 0.05. We also show a fit with a fixed slope of 1, that is, a linear fit, by the orange dashed line. The source index ID is indicated in Fig. 1 and Table 3.
including (U)LIRGs from Jiao et al. (2017; dark purple) H-ATLAS SMGs (red) and other SMGs from Walter et al. (2011; green). Two of our sources, NAv1.177 (#9) and G12v2.257 (#15) are lacking lens modelling, thus we plot the limit, and the arrows show the direction for lensing correction. A fit to the correlation from the local to high-redshift galaxies is indicated by the blue line, with a slope of 0.94 ± 0.05. We also show a fit with a fixed slope of 1, that is, a linear fit, by the orange dashed line. The source index ID is indicated in Fig. 1 and Table 3.
Current usage metrics show cumulative count of Article Views (full-text article views including HTML views, PDF and ePub downloads, according to the available data) and Abstracts Views on Vision4Press platform.
Data correspond to usage on the plateform after 2015. The current usage metrics is available 48-96 hours after online publication and is updated daily on week days.
Initial download of the metrics may take a while.