Fig. 1
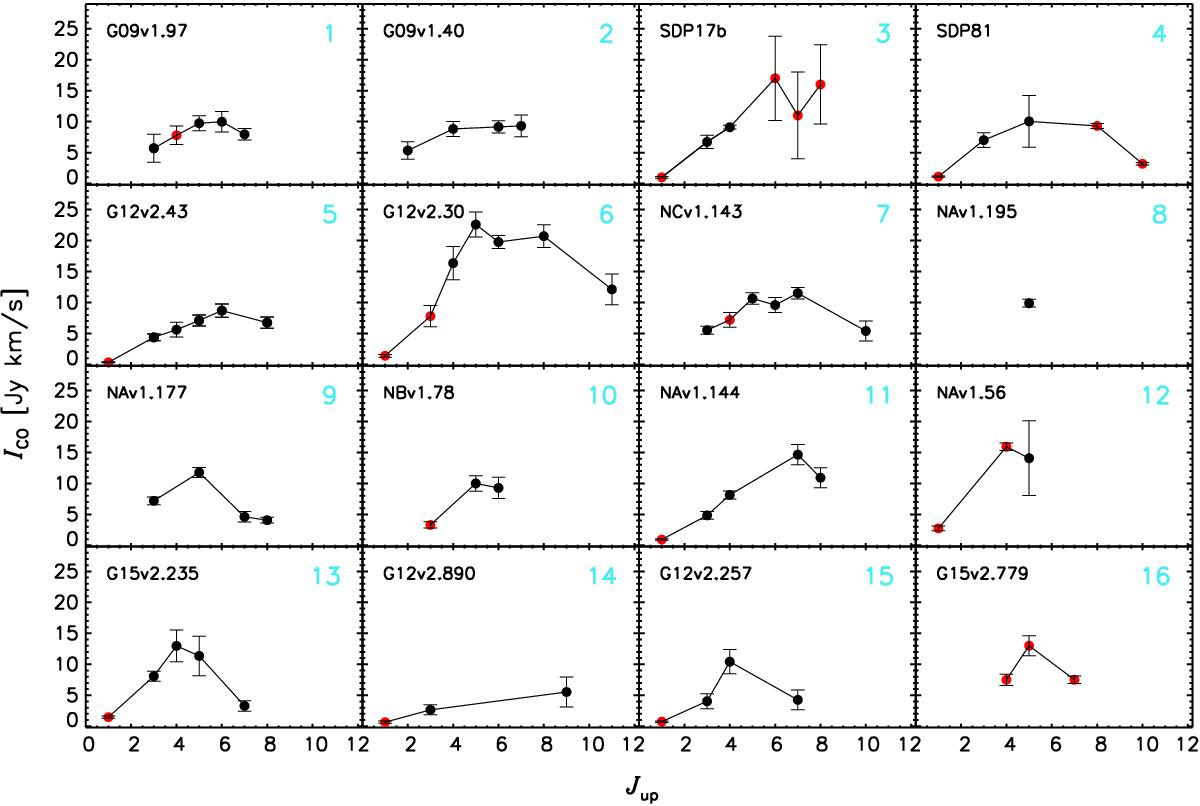
Distribution of the observed velocity-integrated CO line flux density versus the rotational quantum number Jup for each transition, i.e. CO SLEDs. Black dots with error bars are the velocity integrated flux densities from this work. Red dots are the data from other works: all CO(1–0) data are from Harris et al. (2012); CO(4–3) in G09v1.97 is from Riechers et al. (in prep.); CO(6–5) , CO(7–6) and CO(8–7) in SDP 17b are from Lupu et al. (2012); CO(8–7) and CO(10−9) in SDP 81 are from ALMA Partnership (2015); CO(3–2) in G12v2.30, CO(4–3)in NCv1.143 and CO(3–2) in NBv1.78 are from O13; CO(4–3) in NAv1.56 is from Oteo et al. (in prep.). For a comparison, we also plot the CO SLED of G15v2.779 (Cox et al. 2011). We mark an index number for each source in turquoise following Table 3 for the convenience of discussion.
Current usage metrics show cumulative count of Article Views (full-text article views including HTML views, PDF and ePub downloads, according to the available data) and Abstracts Views on Vision4Press platform.
Data correspond to usage on the plateform after 2015. The current usage metrics is available 48-96 hours after online publication and is updated daily on week days.
Initial download of the metrics may take a while.