Free Access
Fig. 5
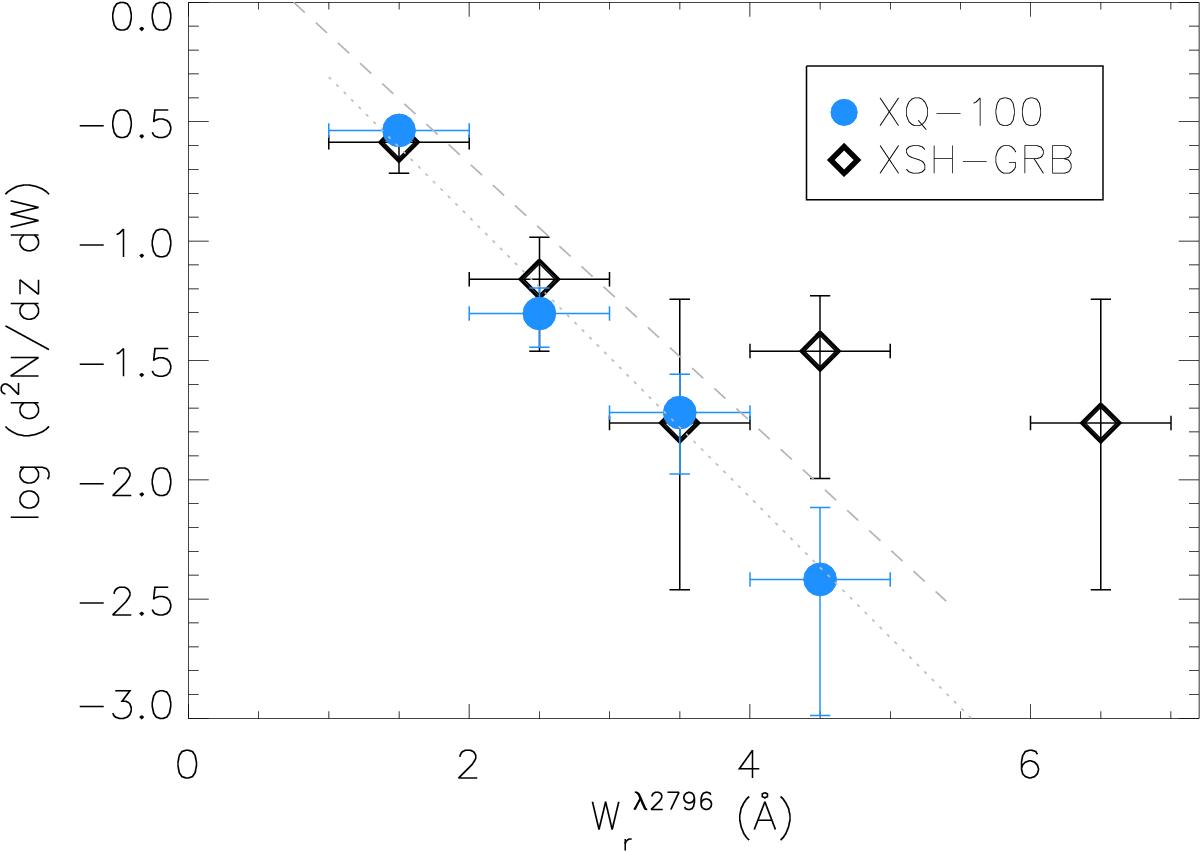
The equivalent width distribution of ![]() of the GRB and quasar samples. Vertical error bars were computed using the
of the GRB and quasar samples. Vertical error bars were computed using the ![]() approximation. The dotted and dashed lines represent best fits for the distribution of quasar absorbers by Mathes et al. (2017) and Chen et al. (2016), respectively.
approximation. The dotted and dashed lines represent best fits for the distribution of quasar absorbers by Mathes et al. (2017) and Chen et al. (2016), respectively.
Current usage metrics show cumulative count of Article Views (full-text article views including HTML views, PDF and ePub downloads, according to the available data) and Abstracts Views on Vision4Press platform.
Data correspond to usage on the plateform after 2015. The current usage metrics is available 48-96 hours after online publication and is updated daily on week days.
Initial download of the metrics may take a while.