Fig. 4
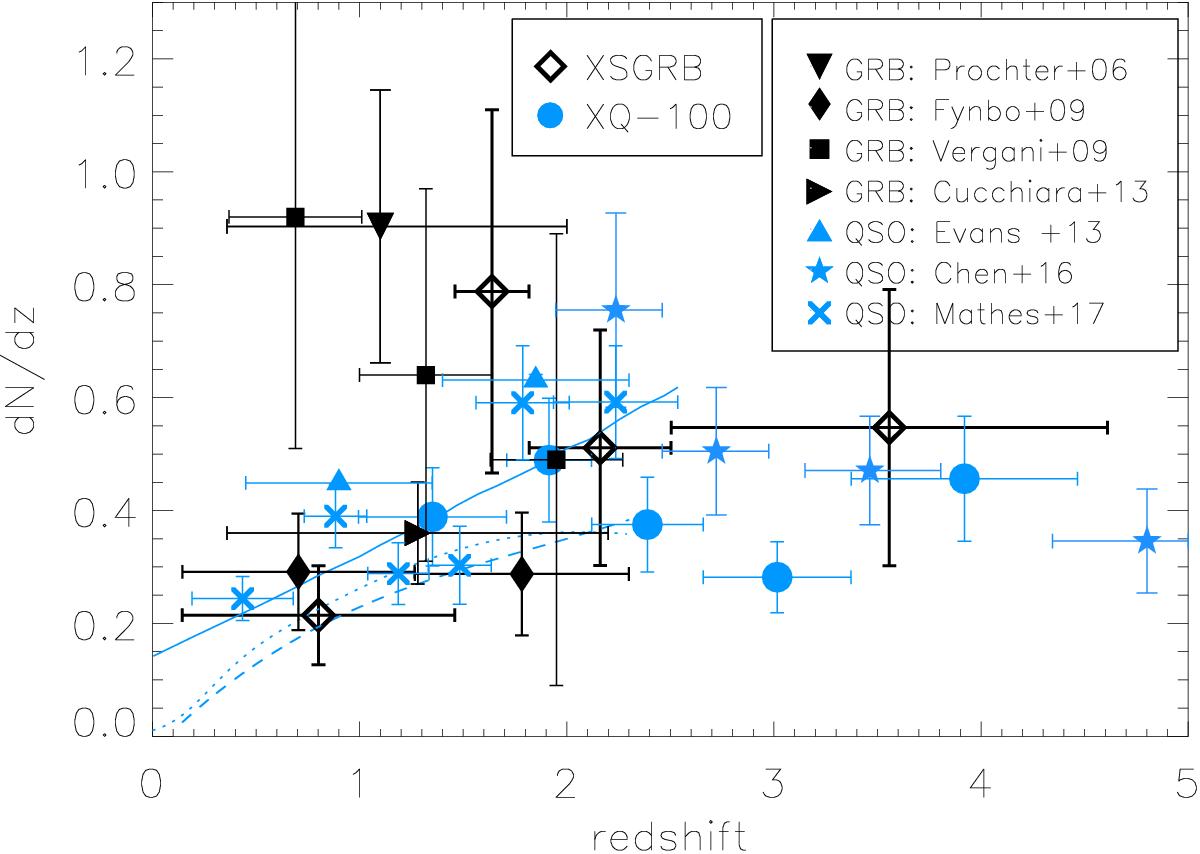
Incidences from the literature for both GRB and quasar absorbers. Symbols are colour coded with all quasar samples shown in blue and GRB samples in black. Incidences from the low-spectral-resolution GRB sample from Fynbo et al. (2009) were re-analysed in this work. This low-resolution data set is also part of the sample compiled by Cucchiara et al. (2013). The dashed and dotted curves show expectations from SDSS quasar data from Prochter et al. (2006a) and Zhu & Ménard (2013), respectively, and the solid line the incidence towards quasars measured with high-spectral-resolution data (Mathes et al. 2017).
Current usage metrics show cumulative count of Article Views (full-text article views including HTML views, PDF and ePub downloads, according to the available data) and Abstracts Views on Vision4Press platform.
Data correspond to usage on the plateform after 2015. The current usage metrics is available 48-96 hours after online publication and is updated daily on week days.
Initial download of the metrics may take a while.