Fig. 3
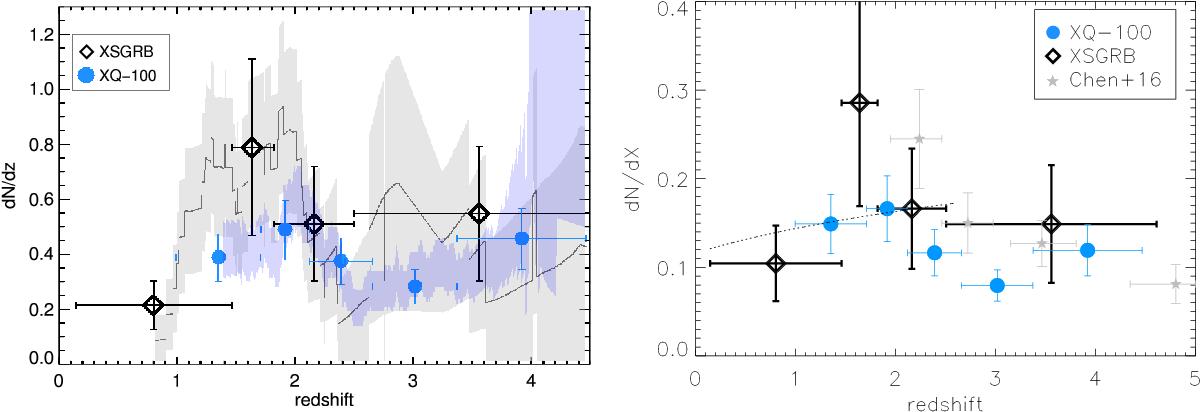
Left hand panel: incidence rates from the two legacy samples of strong Mg ii absorbers with points representing bin sizes with 6 and 20 absorbers in the XSGRB and XQ-100 samples, respectively. The grey line illustrates a sliding redshift binning of XSGRB absorbers and the shaded region presents the 68% confidence levels. The blue shaded region represents the 68% confidence intervals for a similar sliding redshift binning of the XQ-100 sample. Right hand panel: comoving line density. The dotted line represent strong Mg ii absorbers in quasar spectra (Mathes et al. 2017), and the grey stars mark a larger sample of quasar absorbers at high redshifts (Chen et al. 2016).
Current usage metrics show cumulative count of Article Views (full-text article views including HTML views, PDF and ePub downloads, according to the available data) and Abstracts Views on Vision4Press platform.
Data correspond to usage on the plateform after 2015. The current usage metrics is available 48-96 hours after online publication and is updated daily on week days.
Initial download of the metrics may take a while.