Fig. 9
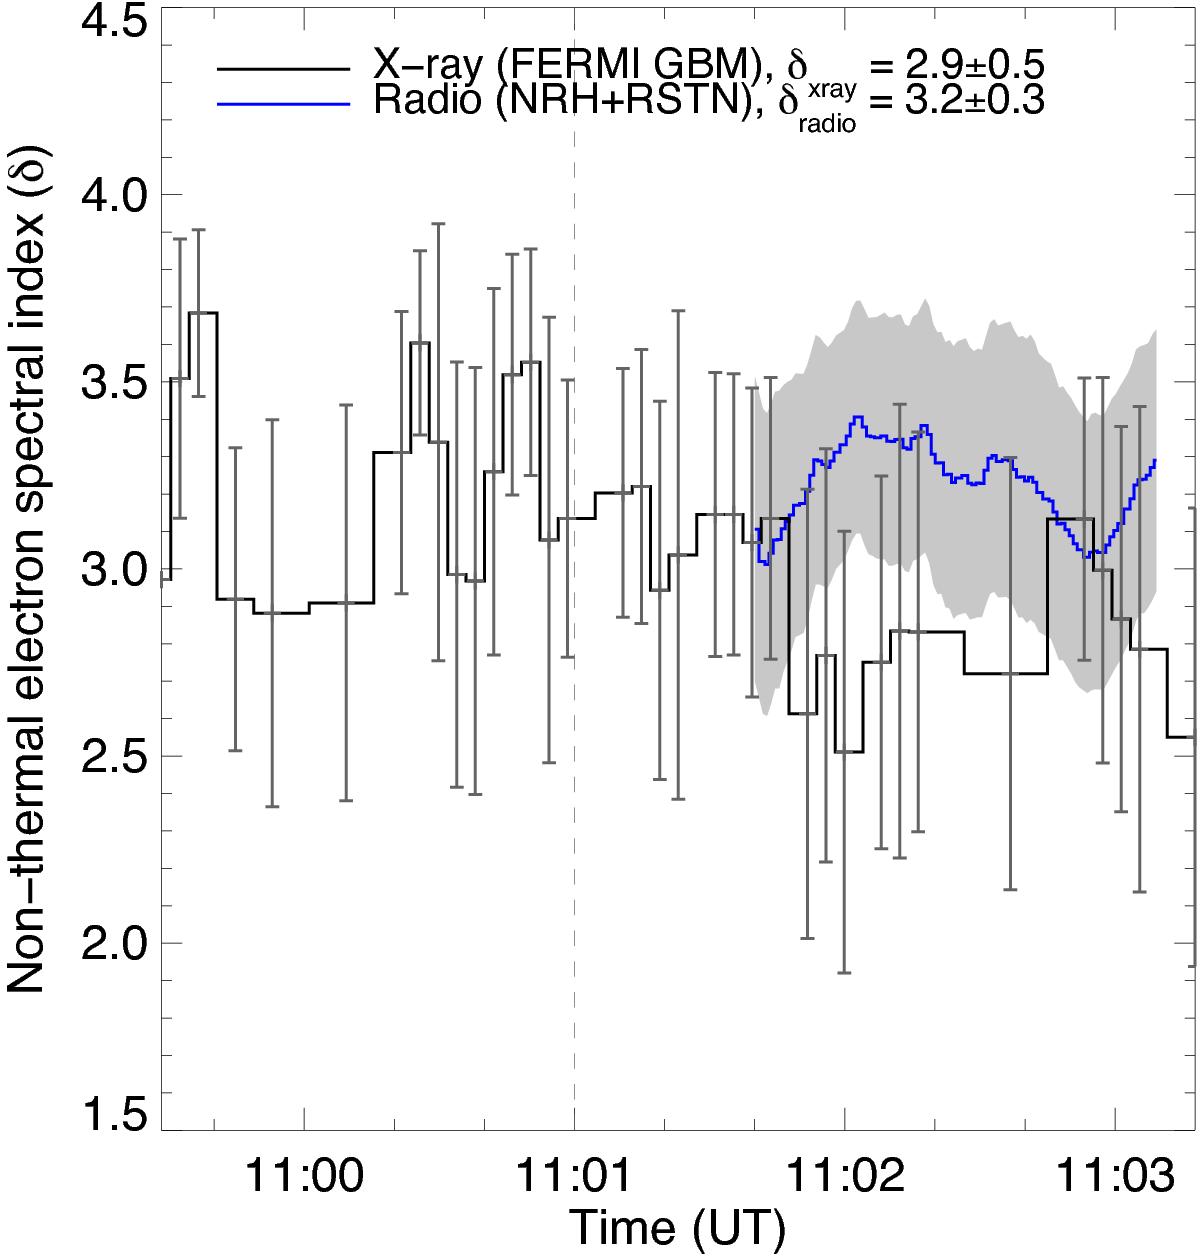
Non-thermal electron spectral indices derived from both X-ray energy spectra (black) and radio flux density spectra (blue) over time. The average values is taken during the time of the second X-ray peak after 11:01 UT (after the dashed line). This gives mean values of δradio = 3.2 ± 0.3 and that from X-ray being δXray = 2.9 ± 0.5. This is indicative of both radio and X-ray emission being produced from electron populations with similar characteristics for example, the electrons producing thin-target X-ray emission may be closely related to those which produce radio.
Current usage metrics show cumulative count of Article Views (full-text article views including HTML views, PDF and ePub downloads, according to the available data) and Abstracts Views on Vision4Press platform.
Data correspond to usage on the plateform after 2015. The current usage metrics is available 48-96 hours after online publication and is updated daily on week days.
Initial download of the metrics may take a while.