Fig. 8
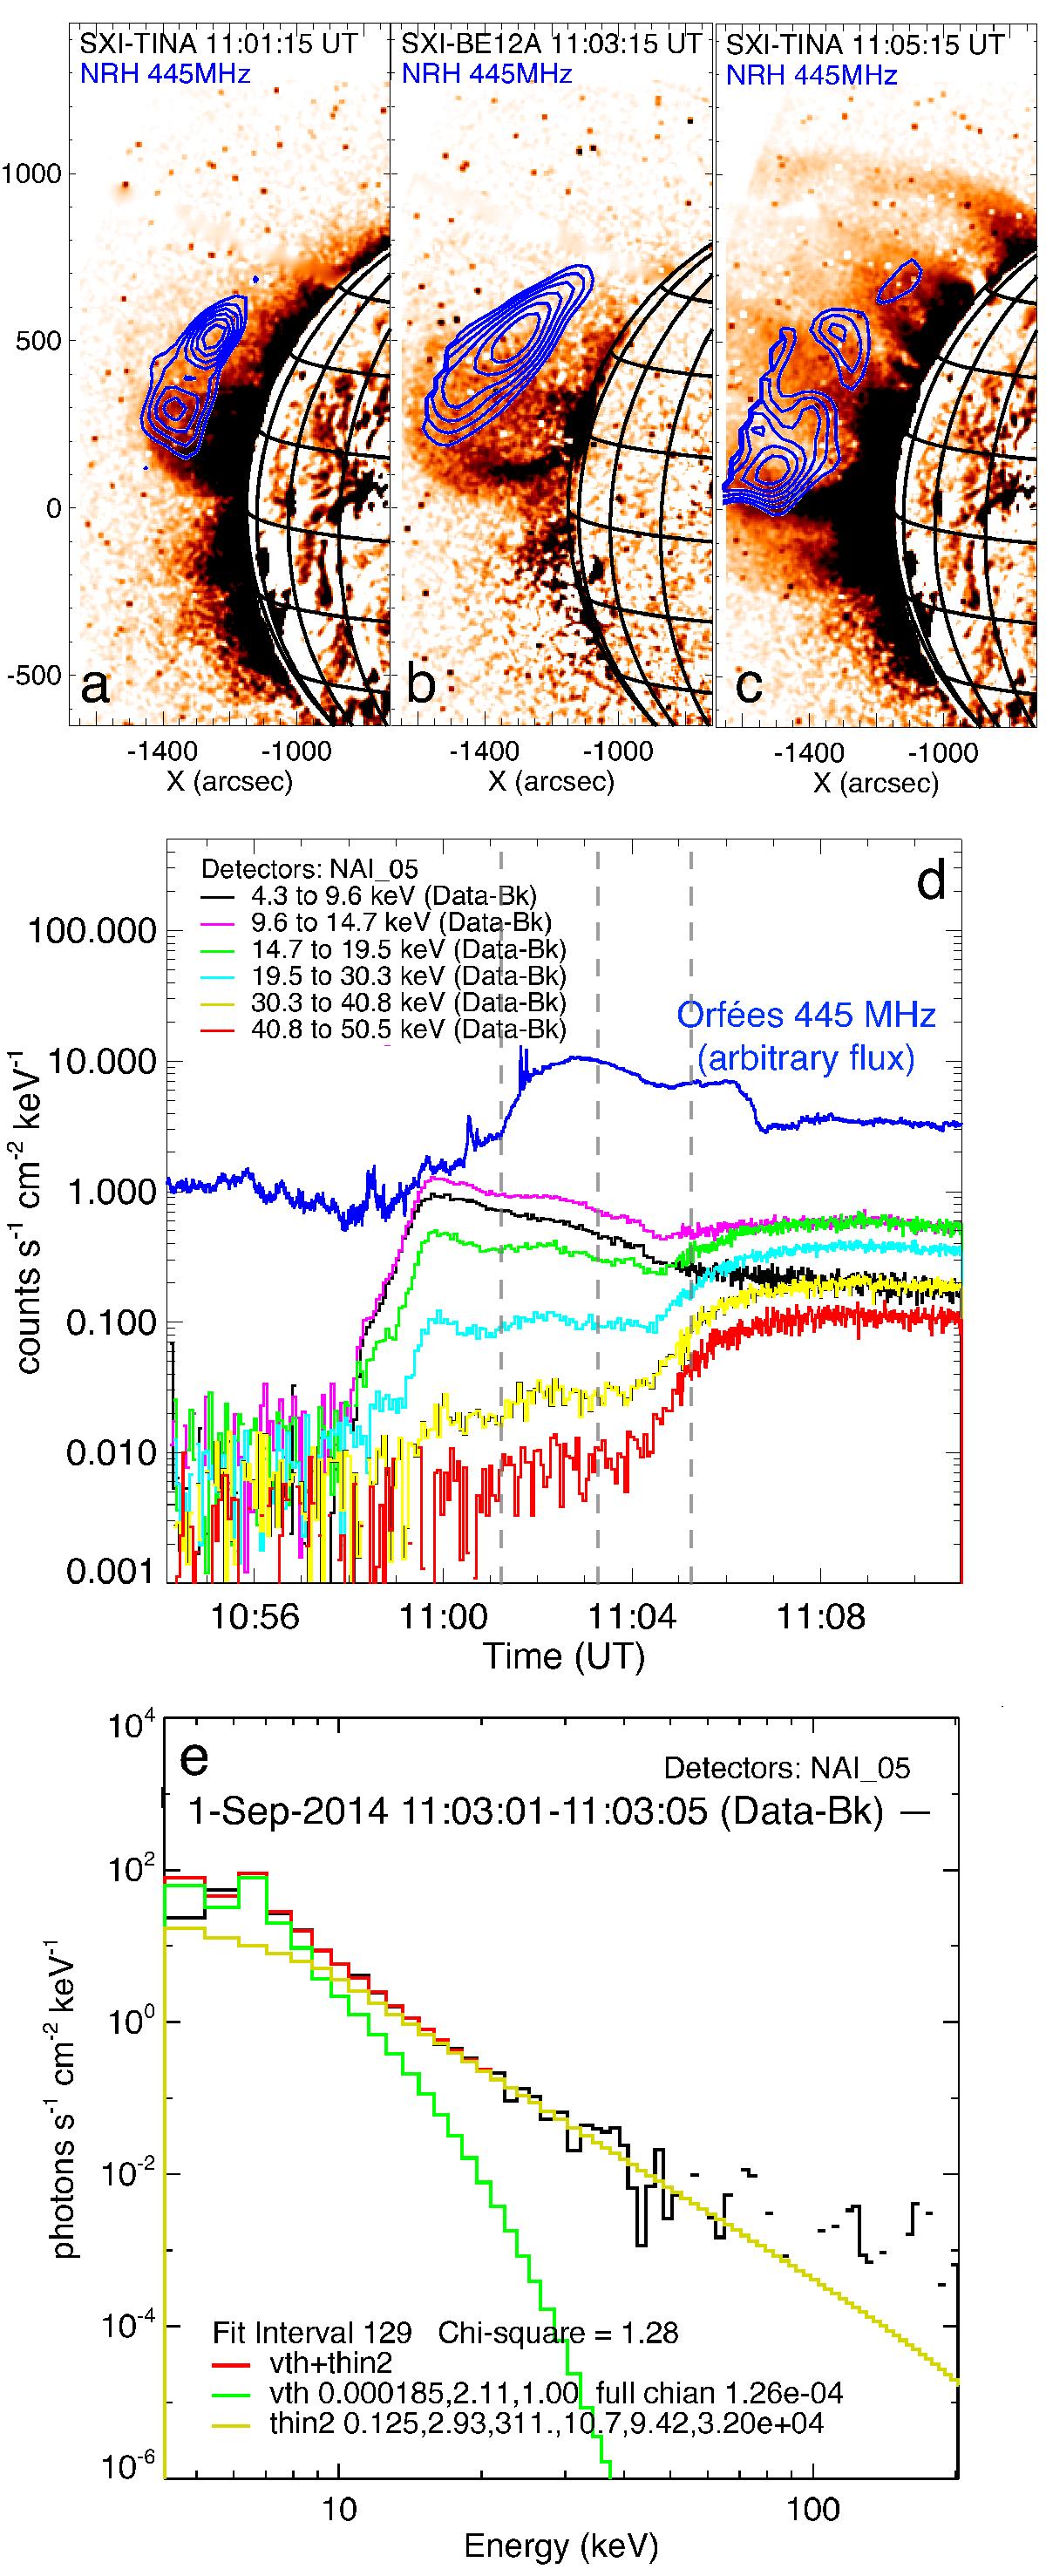
Panels a–c: GOES SXI images showing the evolution of the eruption in soft X-rays, with NRH 445 MHz contours for comparison. Panel d: Fermi GBM counts from 4.2–50.5 keV channels. An increase in counts can be seen in the channels between 4.2–40.8 keV at the time of the event. A 445 MHz flux density curve (with arbitrary flux) from Orfées is shown in blue for comparison. Although the radio and X-ray start to rise at similar times, the radio peak is ~3 min after the X-ray peak. The vertical dashed lines are times of the images above. Panel e: the photon energy spectrum fit with a thermal and thin-target model, given that that the flare was beyond the limb (assumption of no observed thick-target source).
Current usage metrics show cumulative count of Article Views (full-text article views including HTML views, PDF and ePub downloads, according to the available data) and Abstracts Views on Vision4Press platform.
Data correspond to usage on the plateform after 2015. The current usage metrics is available 48-96 hours after online publication and is updated daily on week days.
Initial download of the metrics may take a while.