Fig. 7
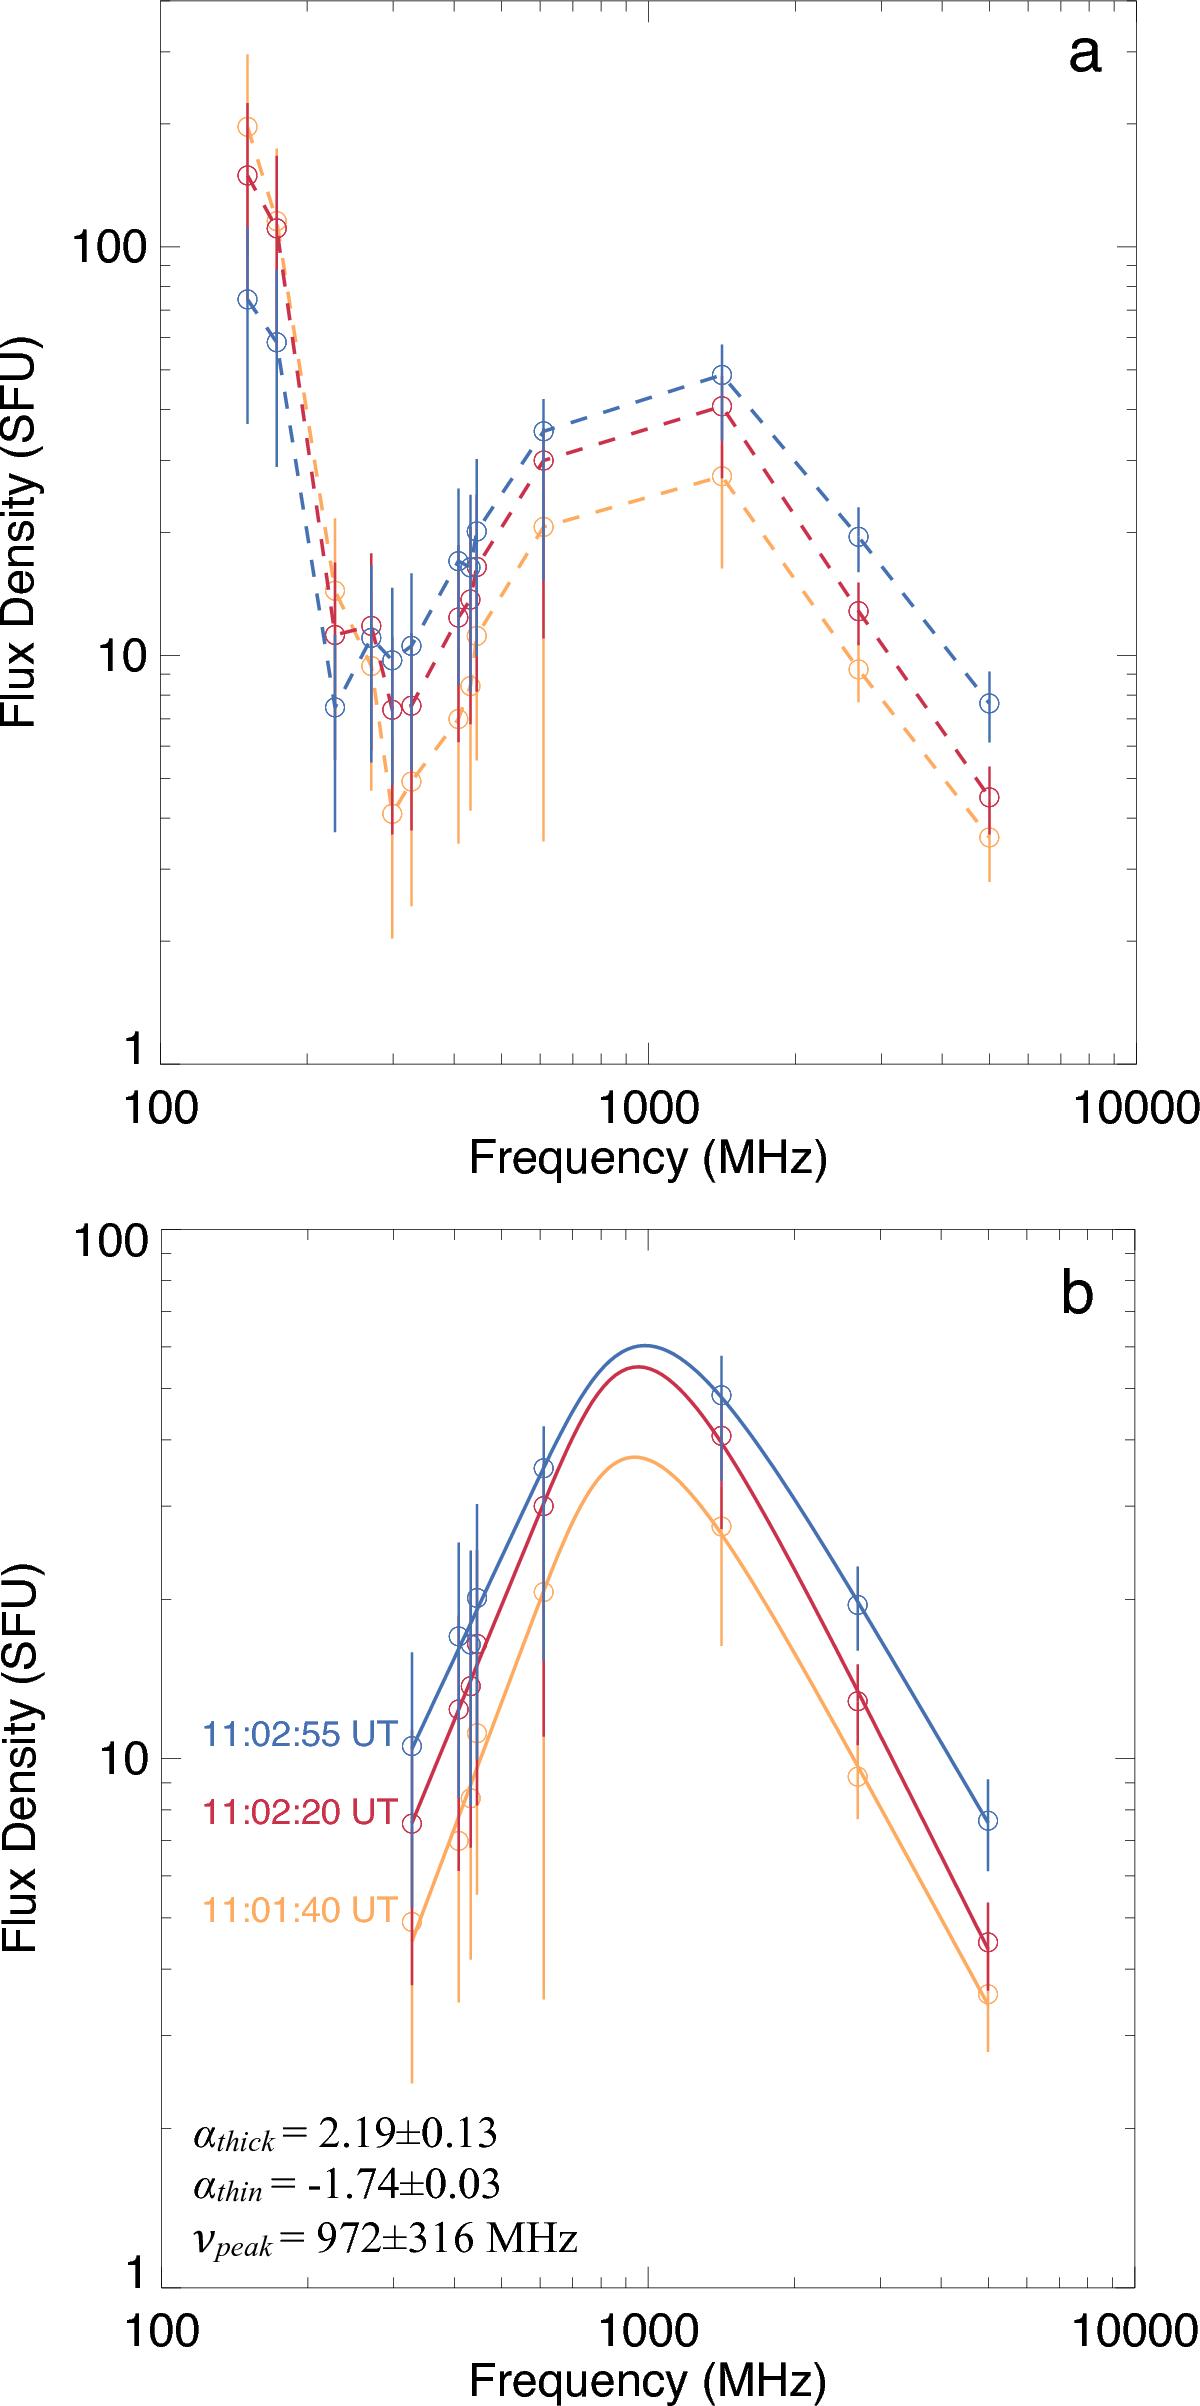
Panel a: flux density spectrum of NRH data below 445 MHz and RSTN data above 615 MHz, at three separate times between 11:01:40 UT to 11:03:10 UT (times indicated in bottom panel). The flux densities are high at 150 and 173 MHz, fall to a minimum at ~300 MHz, reach a peak ~1 GHz and fall again. This is characteristic of a gyrosynchrotron spectrum at frequencies higher than ~300 MHz with plasma emission dominating at lower frequencies. Panel b: parametric fit of a gyrosynchrotron spectrum from 298 MHz to 4.5 GHz at three separate times.
Current usage metrics show cumulative count of Article Views (full-text article views including HTML views, PDF and ePub downloads, according to the available data) and Abstracts Views on Vision4Press platform.
Data correspond to usage on the plateform after 2015. The current usage metrics is available 48-96 hours after online publication and is updated daily on week days.
Initial download of the metrics may take a while.