Fig. 6
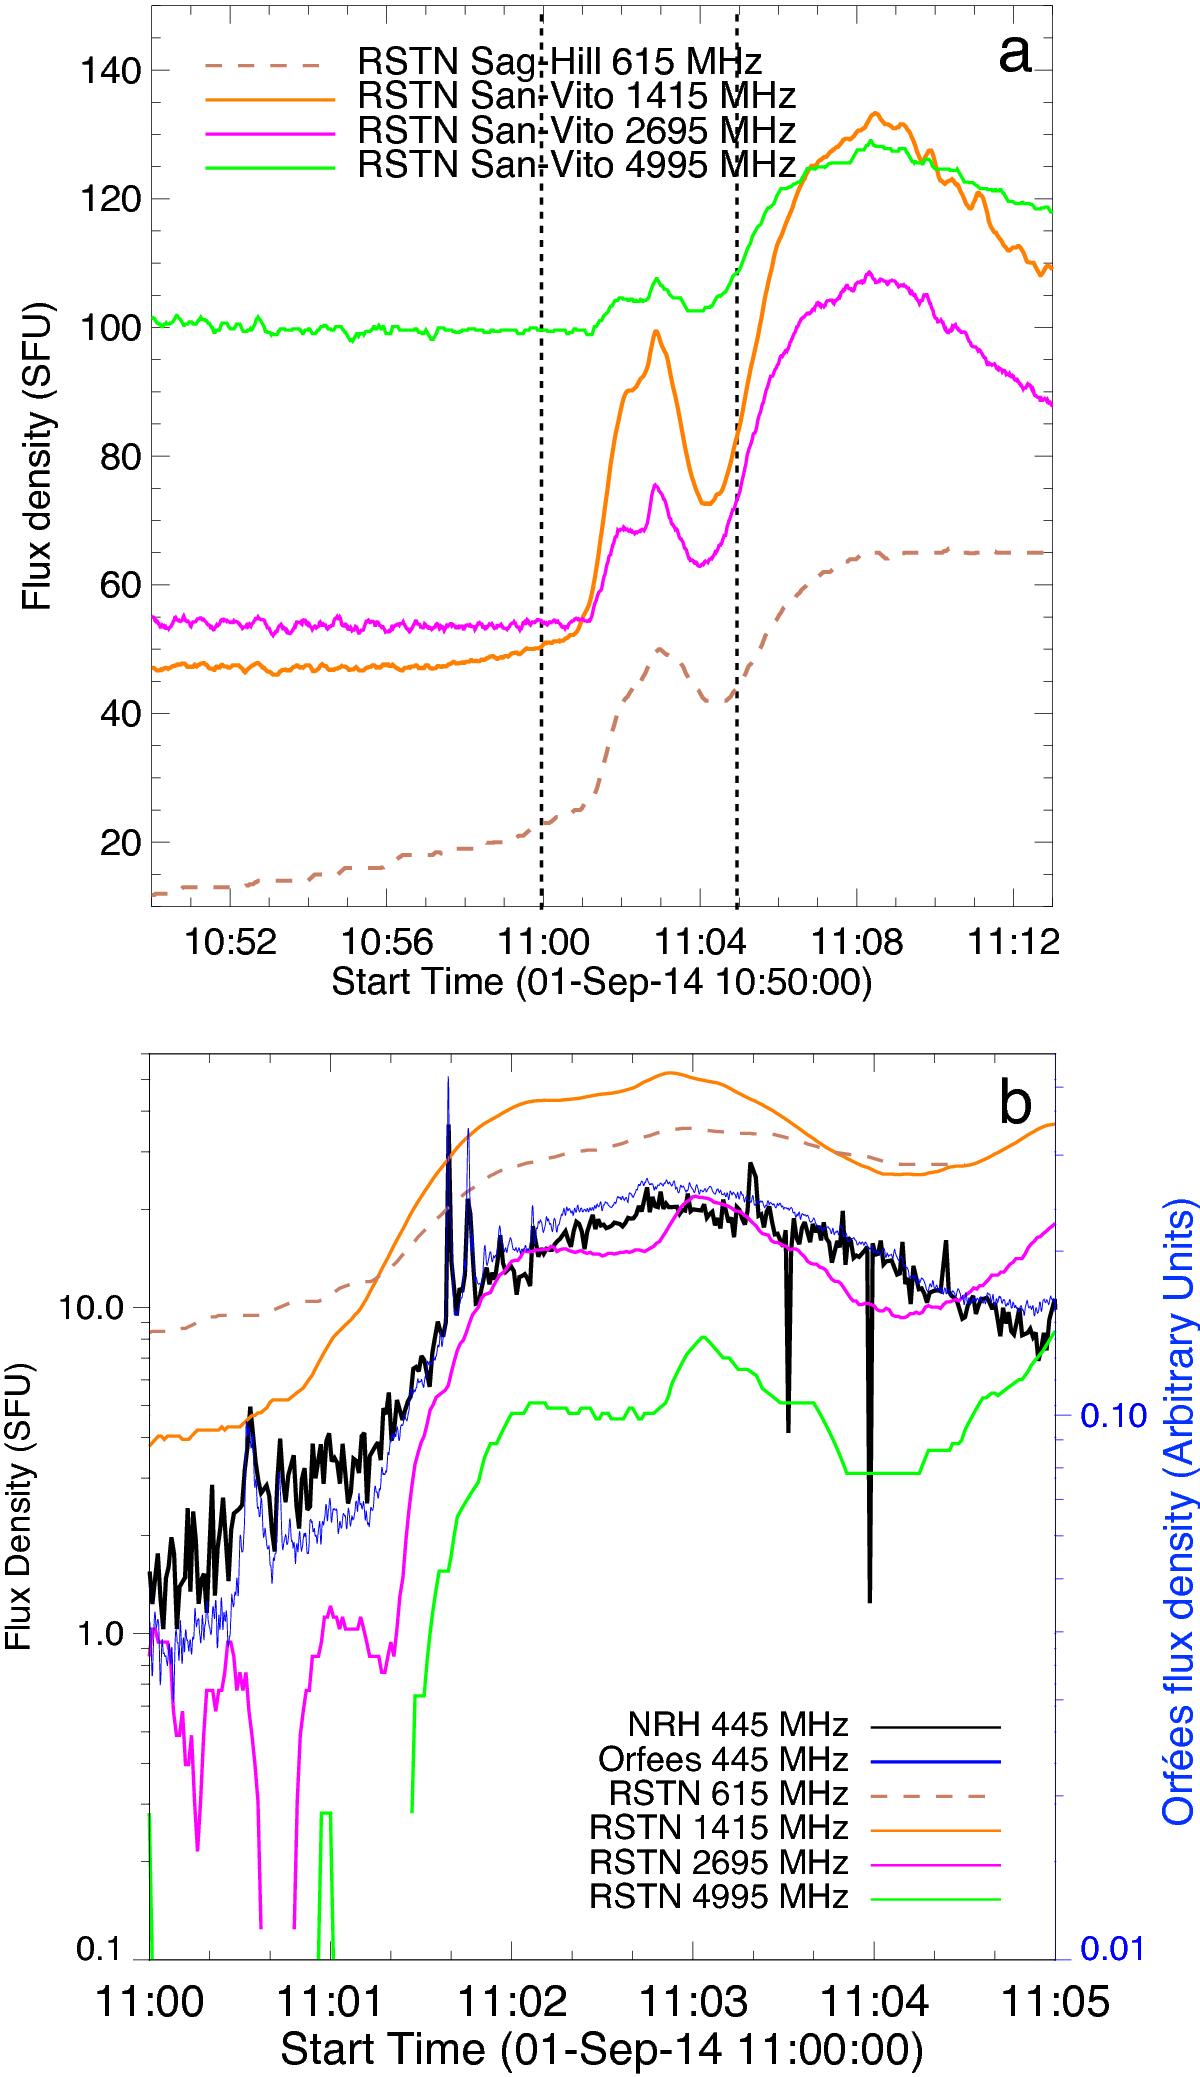
Panel a: flux densities at 615 MHz from Sagamore Hill site and 1.4, 2.7 and 5.0 GHz from the San-Vito site of the RSTN network. Each of the flux density curves has a steady background which lasts for several hours prior to the event. We used this to perform a background subtraction on each frequency (the rise in flux of 615 and 1415 MHz before the time of interest is taken into account in the flux uncertainty at these frequencies in the analysis below). The dashed lines represent the region of interest (the type IV burst). Panel b: magnification of the RSTN flux density spectrum (between the dashed lines demarcated in (a)) with the NRH and Orfées 445 MHz flux density curve for comparison. The flux densities from all three instruments show a good relationship of flux density variation with time.
Current usage metrics show cumulative count of Article Views (full-text article views including HTML views, PDF and ePub downloads, according to the available data) and Abstracts Views on Vision4Press platform.
Data correspond to usage on the plateform after 2015. The current usage metrics is available 48-96 hours after online publication and is updated daily on week days.
Initial download of the metrics may take a while.