Fig. 5
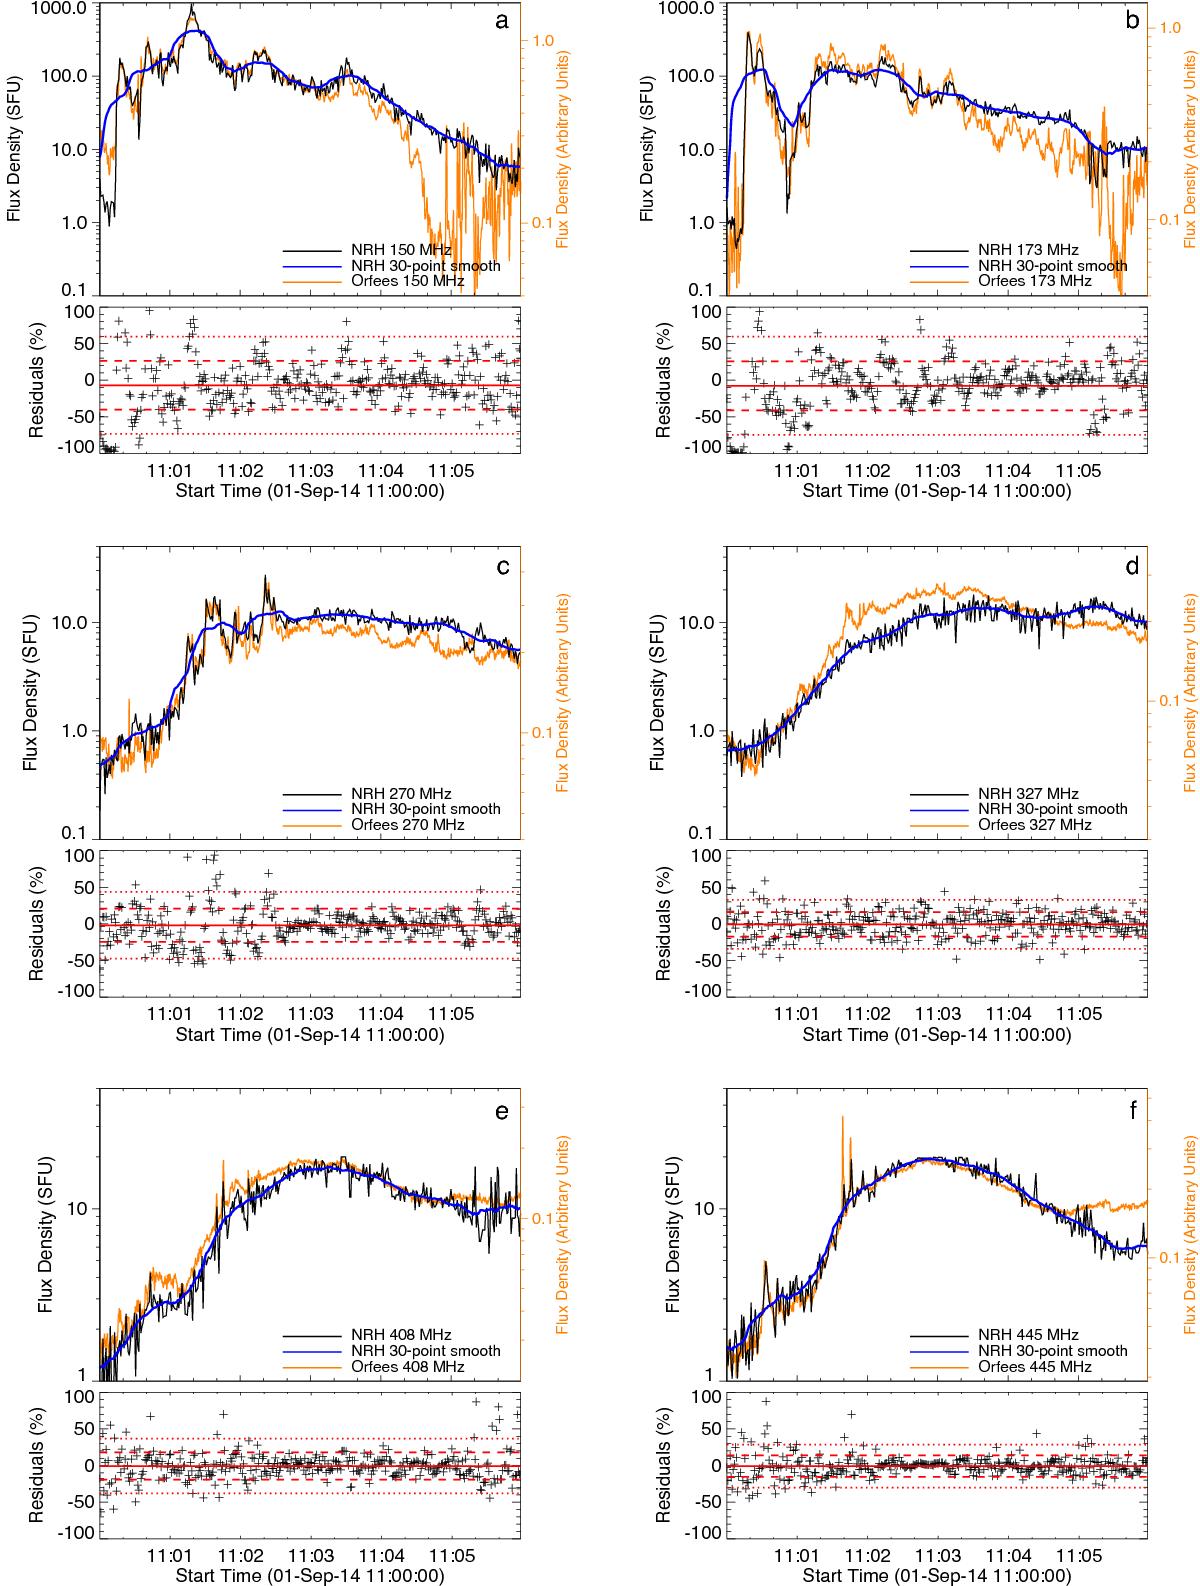
Flux densities of the large radio source for all NRH frequencies (black; units of SFU) and flux density from Orfées at the same frequency (orange; arbitrary units). The blue line is a 30-point box-car smooth of the NRH time profiles. The difference between the black and blue curves provides the residuals over time for each panel. Residuals larger than 2σ are indicative of sporadic radio bursts. The 150–173 MHz sources have much larger flux densities and are also more bursty in nature (larger residual spread). At 228 MHz and above the flux densities are much weaker, while at 300 MHz and above the flux is weaker and much more smoothly varying in time, that is, the residuals mainly varying by less than 2σ, indicative of flux variation due Gaussian noise only (very few sporadic radio bursts) above these frequencies.
Current usage metrics show cumulative count of Article Views (full-text article views including HTML views, PDF and ePub downloads, according to the available data) and Abstracts Views on Vision4Press platform.
Data correspond to usage on the plateform after 2015. The current usage metrics is available 48-96 hours after online publication and is updated daily on week days.
Initial download of the metrics may take a while.