Fig. 3
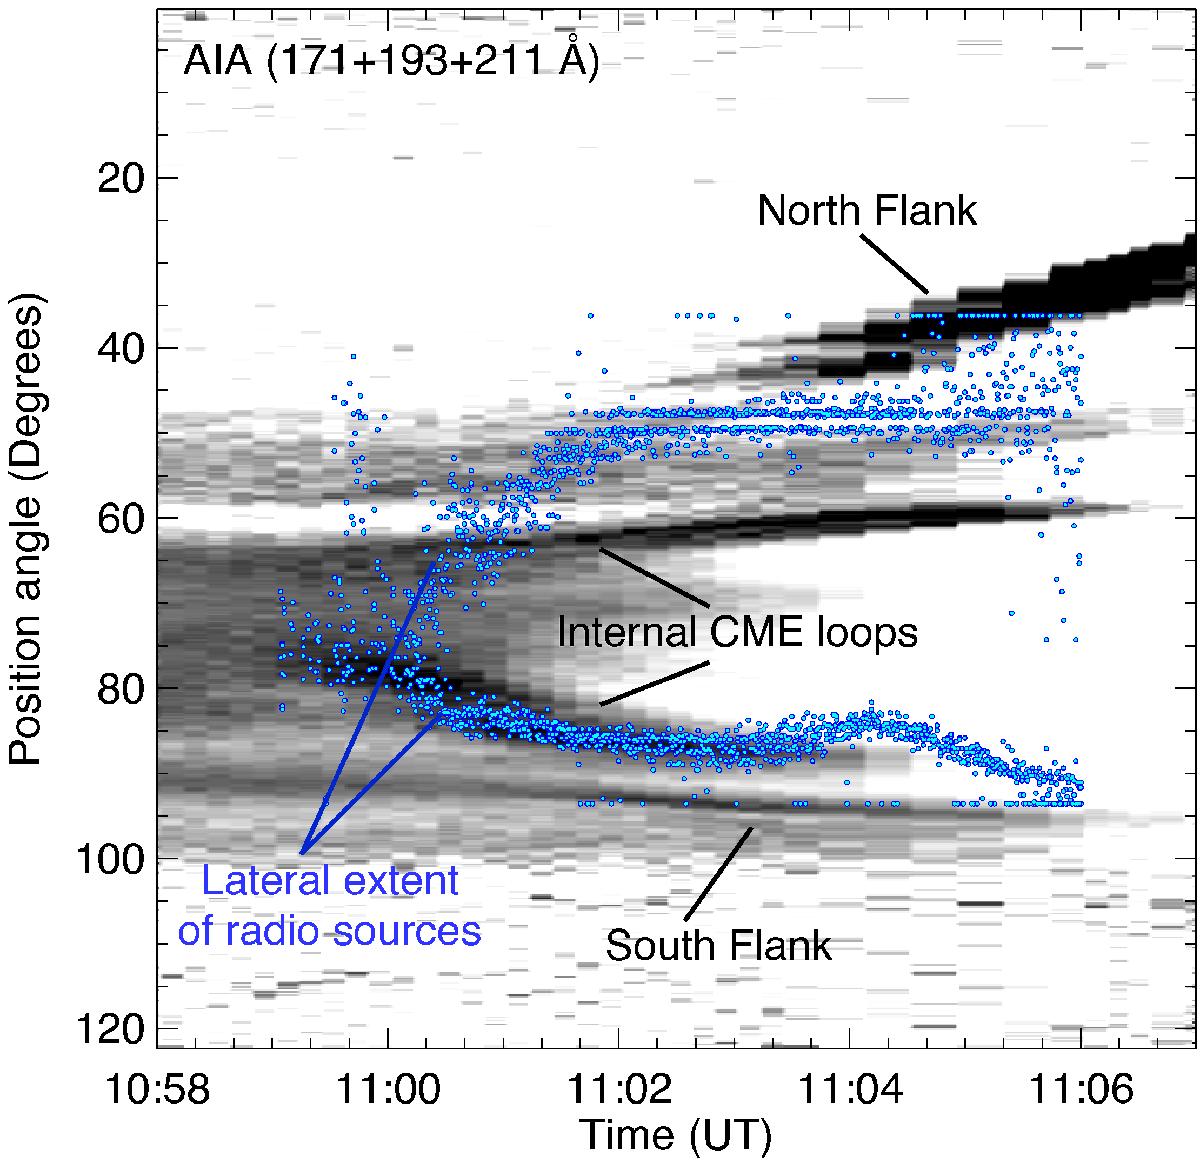
Distance-time map (reverse colour) produced from intensity traces extracted from the orange circle in Fig. 2a. The map is produced from a normalisation then addition of AIA 211 Å, AIA 193 Å, and AIA 171 Å passbands. The upper and lower CME flanks are indicated, along with the expanding inner loops of the CME. The blue points mark the position angles of the upper and lower lateral extent of the 408, 445 and 432 MHz radio sources – the dark blue “×” symbols in Fig. 2a mark these two points on the 432 MHz source for a single time. The radio source expansion follows the CME expansion quite closely. The southern extent of the radio sources in particular follow the expansion of the CME southern internal loop.
Current usage metrics show cumulative count of Article Views (full-text article views including HTML views, PDF and ePub downloads, according to the available data) and Abstracts Views on Vision4Press platform.
Data correspond to usage on the plateform after 2015. The current usage metrics is available 48-96 hours after online publication and is updated daily on week days.
Initial download of the metrics may take a while.