Fig. 2
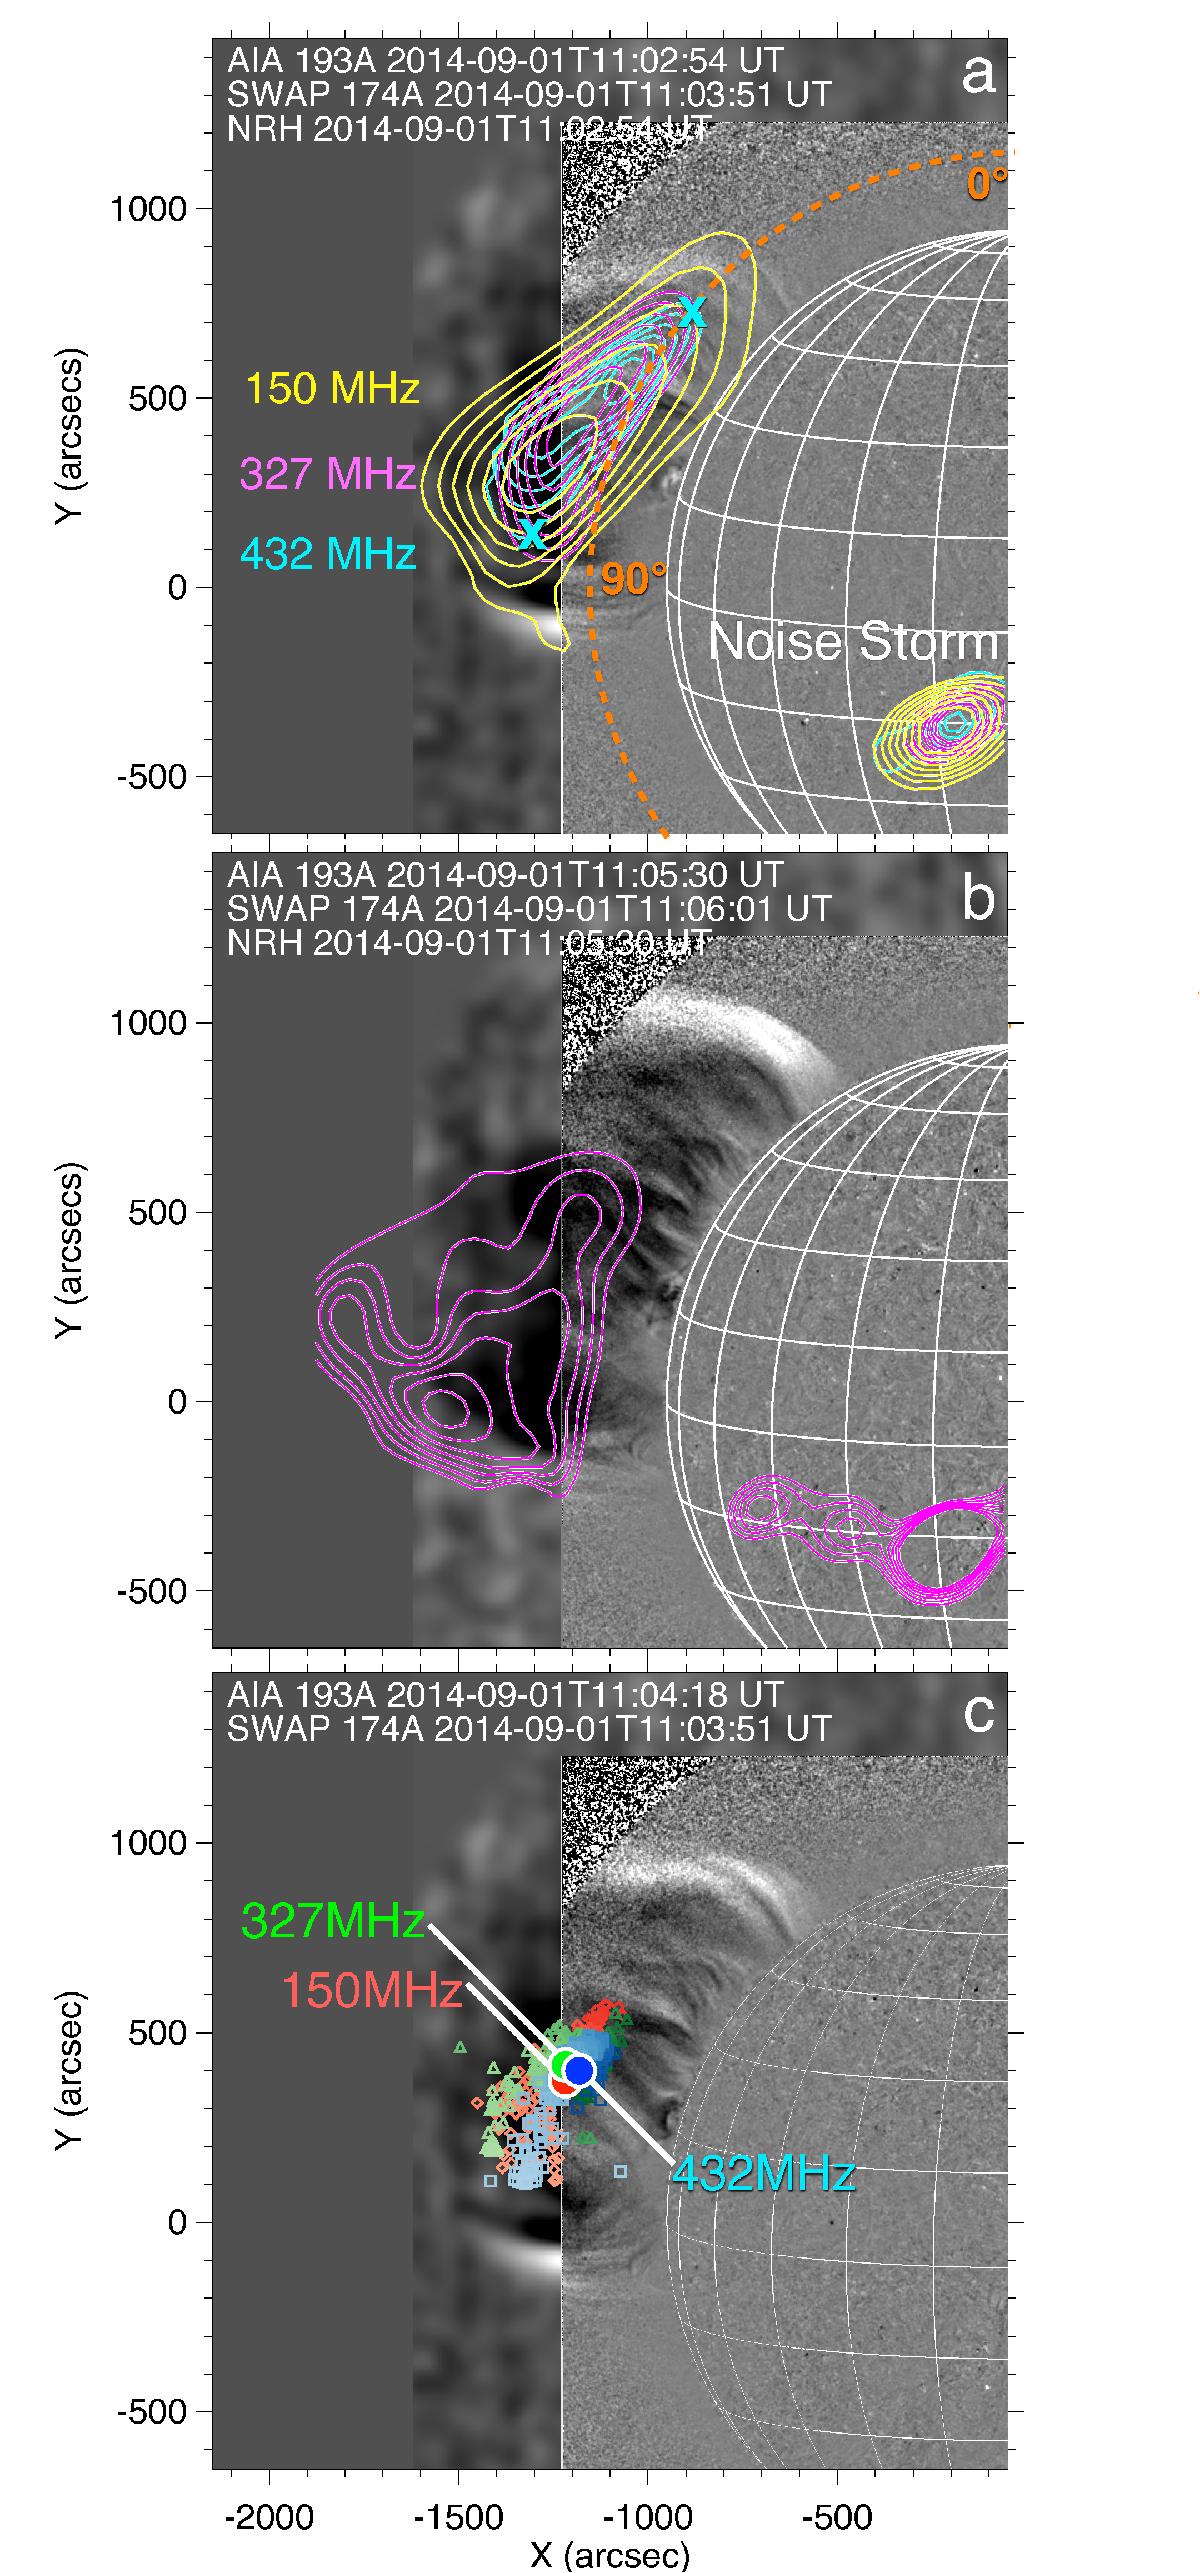
Panel a: eruption from the east limb observed using an AIA 193 Å and SWAP 174 Å ratio images, superimposed with NRH 150, 327 and 432 MHz contours. By 11:01 UT an EUV “bubble” can be seen developing from the east limb. At the same location in the plane of sky, large radio sources appear at all NRH frequencies (just three are shown here). The sources remain at this position until ~11:05 UT. The radio source on disk is a type I noise storm, unrelated to the event in question. Panel b: At 11:05:30 UT, the lower frequency sources (150 MHz) decrease in intensity and the remaining higher frequencies are situated to the southern flank of the eruption (just 327 MHz is shown here). At this time a strong and sharply defined EUV front can be seen propagating towards the north pole. The noise storm on disk is elongated due to the side-lobes of the telescope beam. Panel c: location of sources through time, colours indicate frequency and dark-to-light shading in colour indicates progression through time. The indicated circles are the centroids of each frequency cluster separately.
Current usage metrics show cumulative count of Article Views (full-text article views including HTML views, PDF and ePub downloads, according to the available data) and Abstracts Views on Vision4Press platform.
Data correspond to usage on the plateform after 2015. The current usage metrics is available 48-96 hours after online publication and is updated daily on week days.
Initial download of the metrics may take a while.