Fig. 7
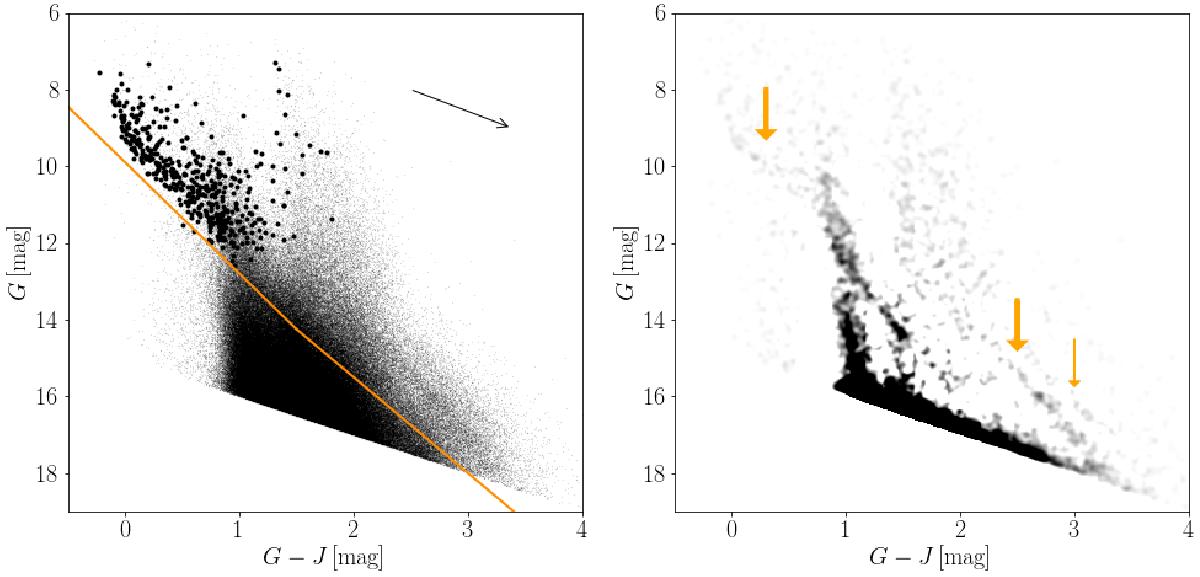
Left: color magnitude diagram of the Gaia sources cross-matched with 2MASS. The sources we focused on are those responsible for the dense, red sequence in the lower part of the diagram. The orange line is defined in Eq. (5)and was used to separate the bulk of the field stars from the population we intended to study. The big black points represent the sources within the TGAS S = 3 contour levels of Fig. 4. The arrow shows the reddening vector corresponding to AV = 1 mag. Right: same color magnitude diagram as on the left, after unsharp masking. The most interesting features (bright, TGAS sequence; faint Gaia DR1 sequence; binary sequence) are highlighted with the orange arrows.
Current usage metrics show cumulative count of Article Views (full-text article views including HTML views, PDF and ePub downloads, according to the available data) and Abstracts Views on Vision4Press platform.
Data correspond to usage on the plateform after 2015. The current usage metrics is available 48-96 hours after online publication and is updated daily on week days.
Initial download of the metrics may take a while.