Fig. 2
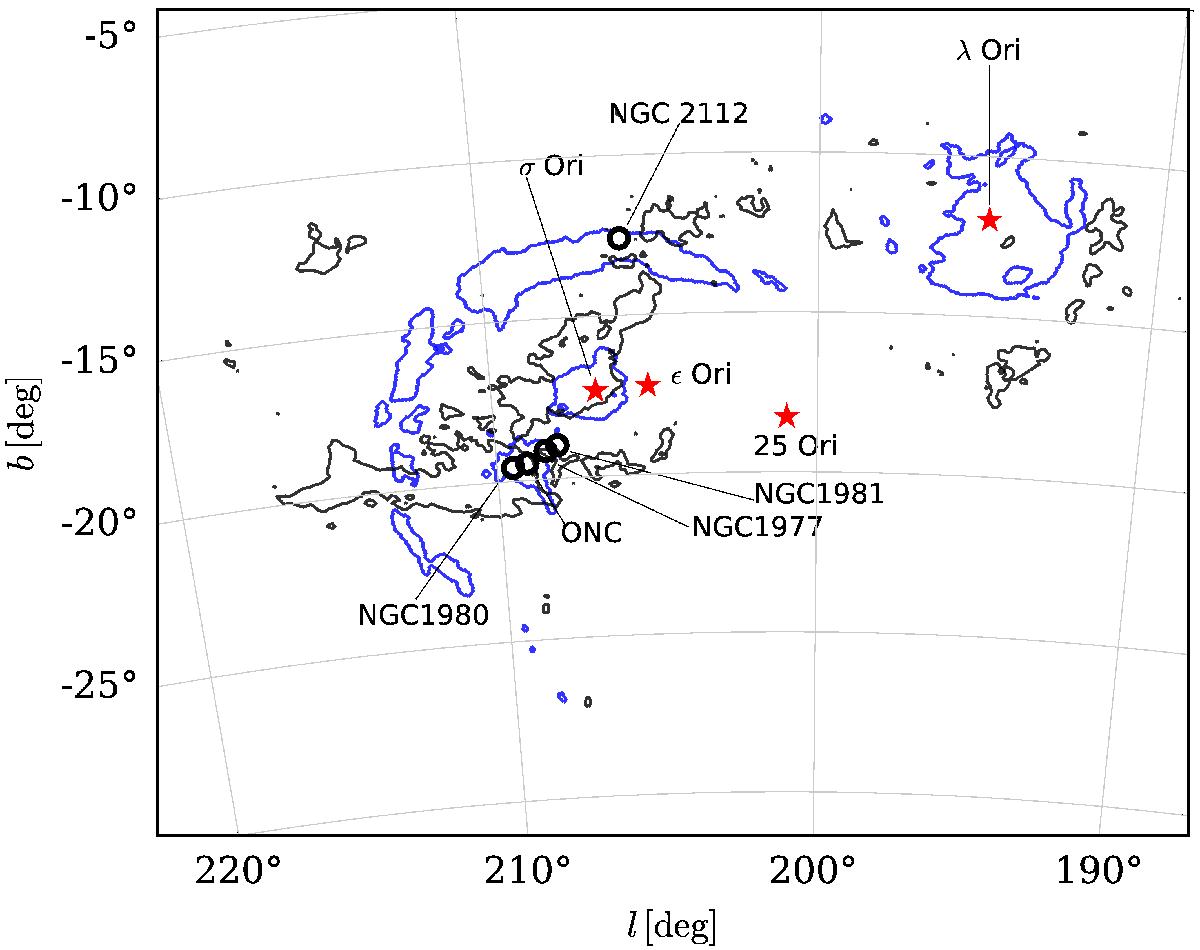
Schematic representation of the field. The black contours correspond to the regions where AV > 2.5 mag (Planck Collaboration XI 2014), while the blue contours show the Hα structures (Finkbeiner 2003) Barnard’s loop and the λ Ori bubble. The positions of some known groups and stars are indicated with black circles and red stars, respectively.
Current usage metrics show cumulative count of Article Views (full-text article views including HTML views, PDF and ePub downloads, according to the available data) and Abstracts Views on Vision4Press platform.
Data correspond to usage on the plateform after 2015. The current usage metrics is available 48-96 hours after online publication and is updated daily on week days.
Initial download of the metrics may take a while.