Fig. 11
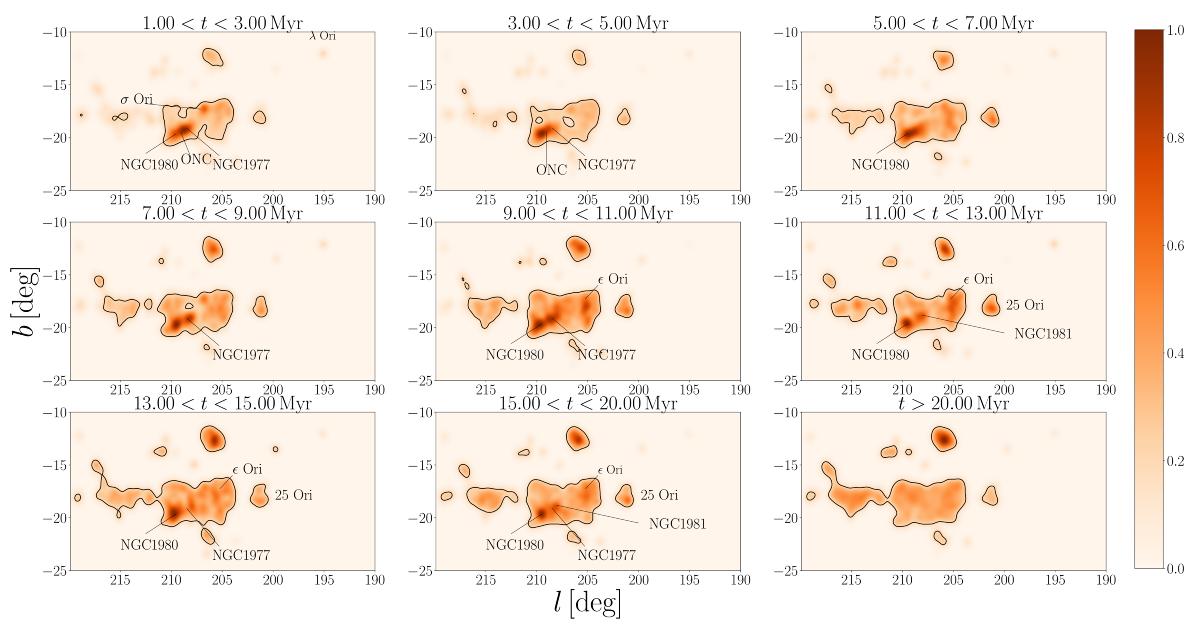
Distribution on the sky of the sources selected in Sect. 3.2 for various age intervals. The ages are computed using the isochrone fitting procedure described in Sect. 3.4. The contours represent the 0.05 density level and are shown only for visualization purposes; the position of the density enhancements changes depending on the age. The first eight panels show stars with estimated ages <20 Myr, while the last one shows older sources. The young stars are not coeval, in particular the age distribution shows a gradient going from 25 Ori and ϵ Ori toward the ONC and NGC 1980. The last panel shows the field stars, whose estimated age is older than 20 Myr.
Current usage metrics show cumulative count of Article Views (full-text article views including HTML views, PDF and ePub downloads, according to the available data) and Abstracts Views on Vision4Press platform.
Data correspond to usage on the plateform after 2015. The current usage metrics is available 48-96 hours after online publication and is updated daily on week days.
Initial download of the metrics may take a while.