Fig. 8
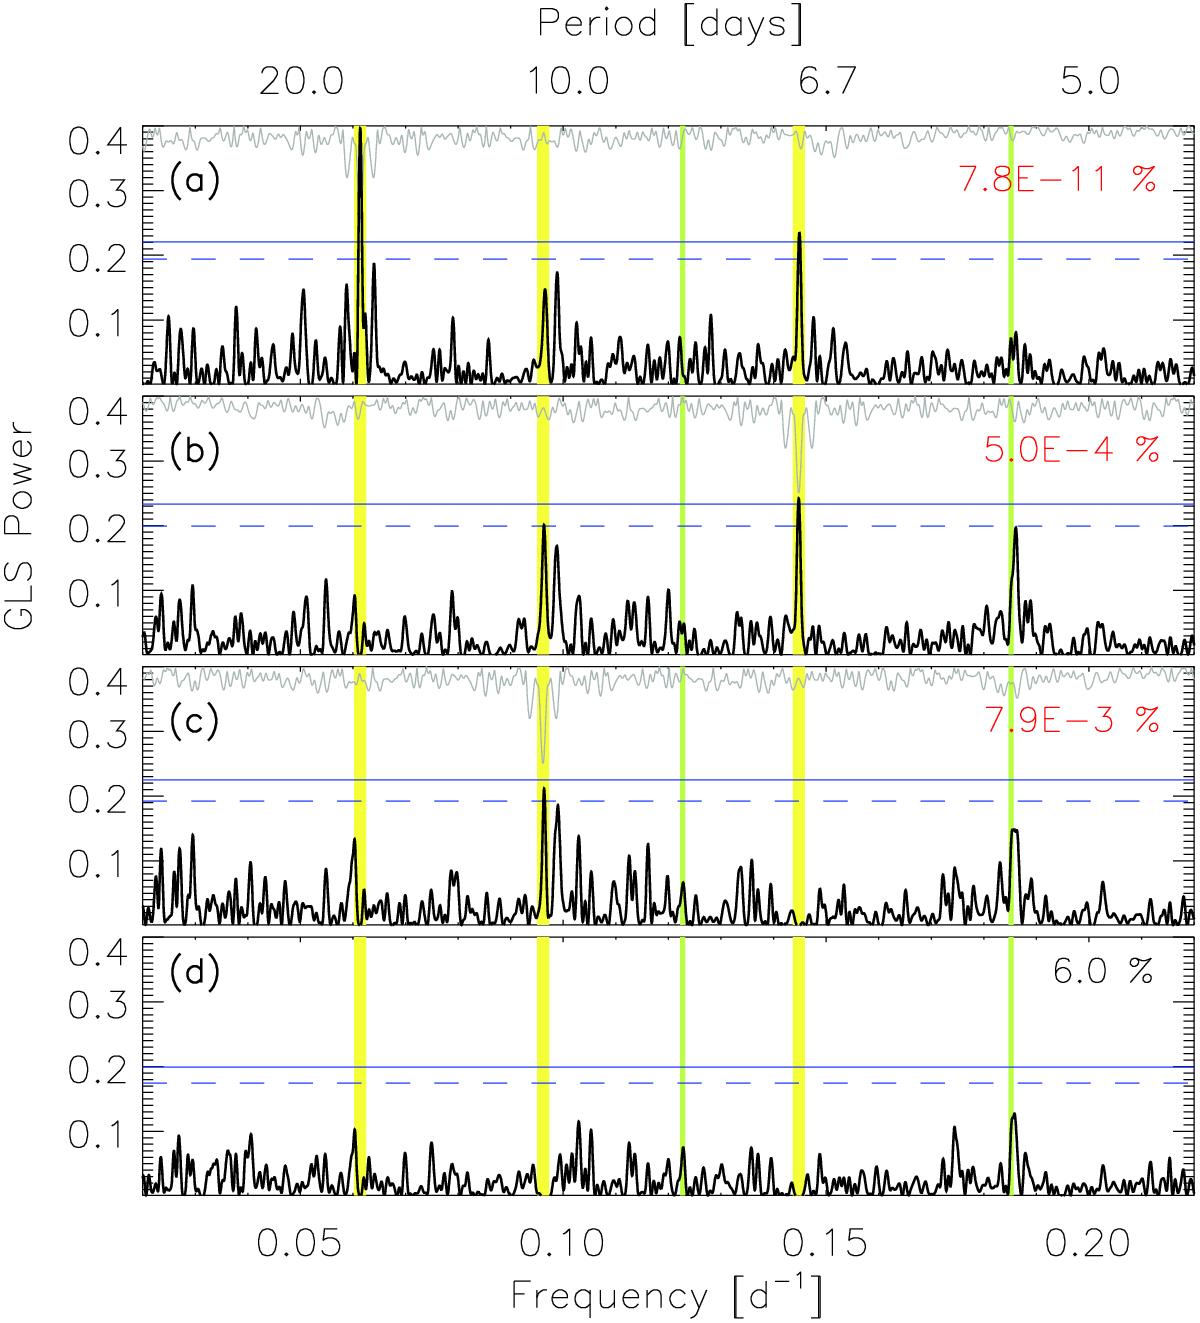
GLS periodograms of the RV data of GJ 3942. The contents of the panels are a) the periodogram of the RV data; b) residuals after correcting for a 16.3-day signal; c) residuals after subtracting simultaneously 16.3- and 6.9-day signals; and d) residuals after simultaneously correcting for signals at 16.3, 6.9, and 10.4 days. For each panel, we give the analytical FAP of the respective model (in red if FAP < 0.1%). Yellow bands indicate the periods at 16.3, 10.4, and 6.9 days. The green lines show the first and second harmonics of the 16.3-day signal, namely 8.2 and 5.4 days. Blue horizontal lines show the 1% (dashed) and 0.1% (solid) FAP levels (from bootstrapping) of the respective dataset. Additionally, we show in the upper parts of each periodogram the WF in gray after being flipped, scaled, mirrored, and period-shifted to the main peak of the respective dataset.
Current usage metrics show cumulative count of Article Views (full-text article views including HTML views, PDF and ePub downloads, according to the available data) and Abstracts Views on Vision4Press platform.
Data correspond to usage on the plateform after 2015. The current usage metrics is available 48-96 hours after online publication and is updated daily on week days.
Initial download of the metrics may take a while.