Free Access
Fig. 7
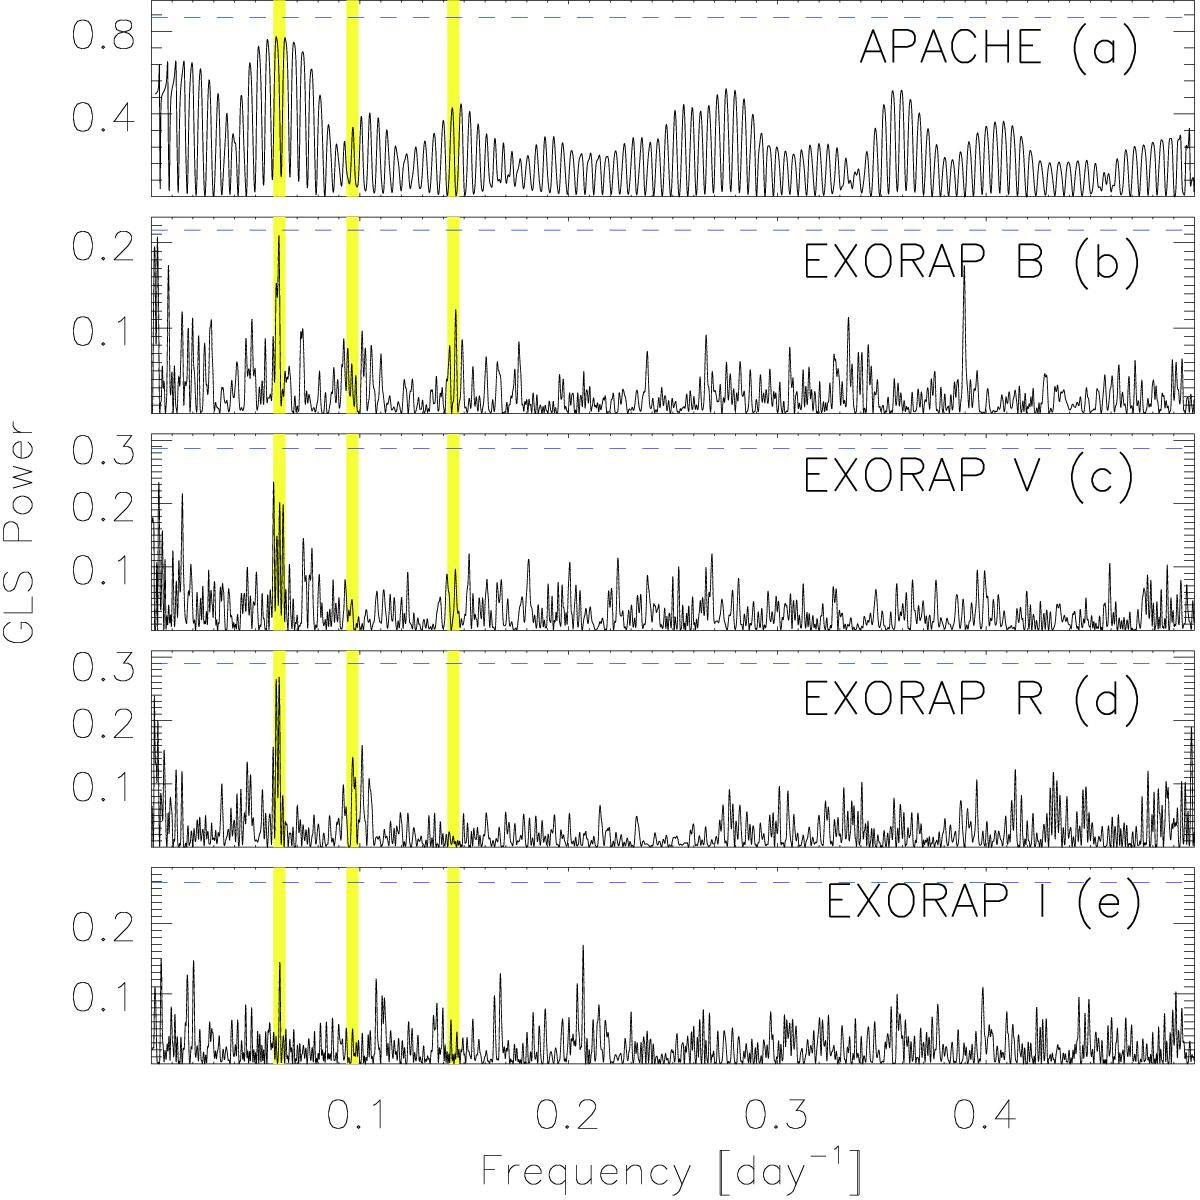
GLS periodograms of the different photometric datasets including the APACHE V filter (panel a) and EXORAP filters B (panel b), V (panel c), R (panel d), and I (panel e). The yellow bands indicate the periods at 16.3, 10.4, and 6.9 days. The blue dashed horizontal line indicates the 1% FAP level.
Current usage metrics show cumulative count of Article Views (full-text article views including HTML views, PDF and ePub downloads, according to the available data) and Abstracts Views on Vision4Press platform.
Data correspond to usage on the plateform after 2015. The current usage metrics is available 48-96 hours after online publication and is updated daily on week days.
Initial download of the metrics may take a while.