Fig. 6
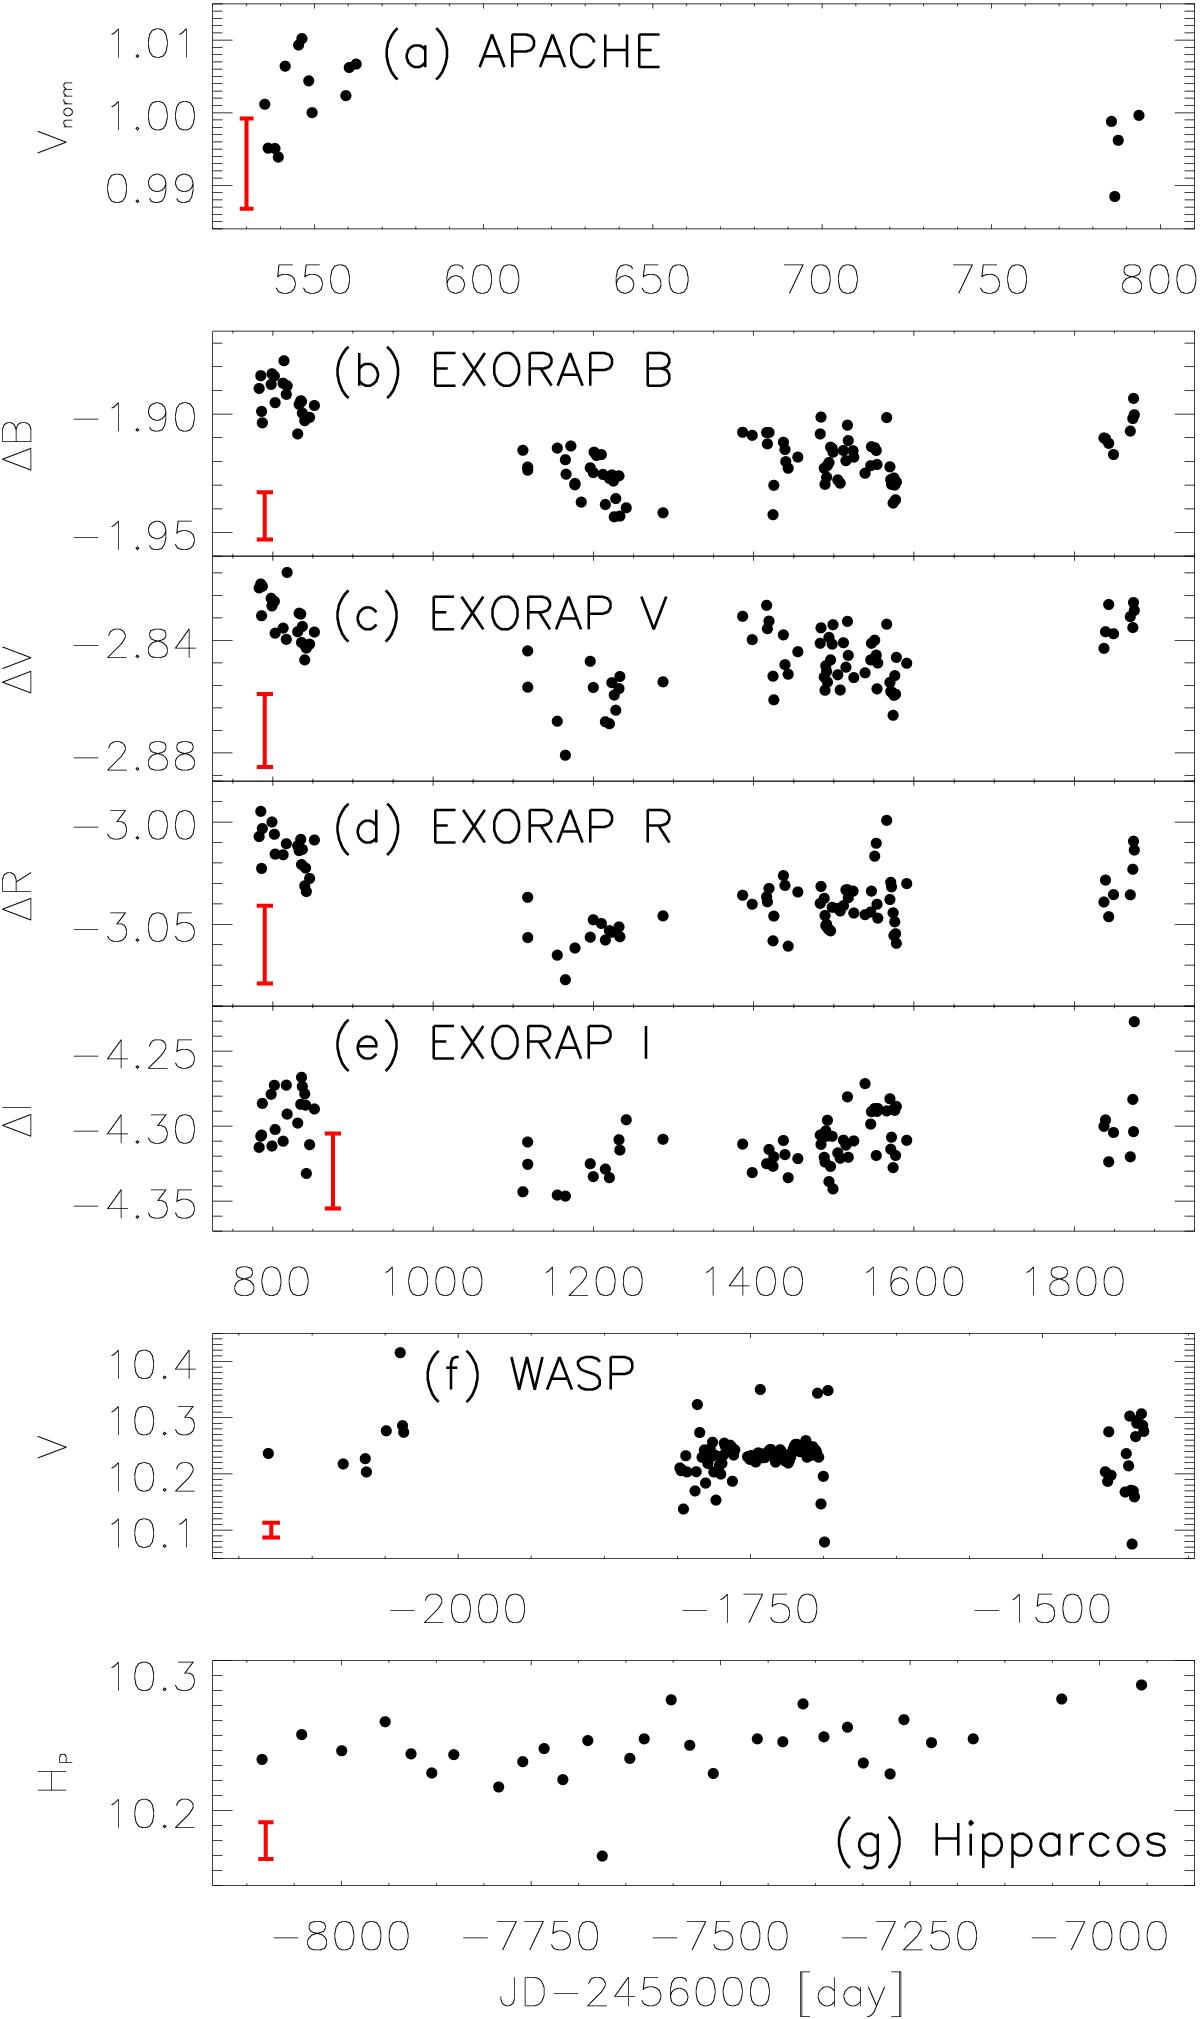
Photometry of GJ 3942 including normalized data from APACHE (panel a), magnitude differences (GJ 3942 and calibration stars) of EXORAP filters B (panel b), V (panel c), R (panel d), and I (panel e), and visual magnitudes from the WASP (panel f) and Hipparcos catalogs (panel g). The red lines on the lower left show the rms of the nightly averages (panels a, f, g) and the RV rms of the calibration stars (b to e) as proxies for the uncertainties of the measurements. We note that APACHE was used during seasons 1 and 2 of the HARPS-N observations, EXORAP from season 2 to 4 and beyond, and WASP and Hipparcos data are from around 2007 and 1991, respectively.
Current usage metrics show cumulative count of Article Views (full-text article views including HTML views, PDF and ePub downloads, according to the available data) and Abstracts Views on Vision4Press platform.
Data correspond to usage on the plateform after 2015. The current usage metrics is available 48-96 hours after online publication and is updated daily on week days.
Initial download of the metrics may take a while.