Free Access
Fig. 5
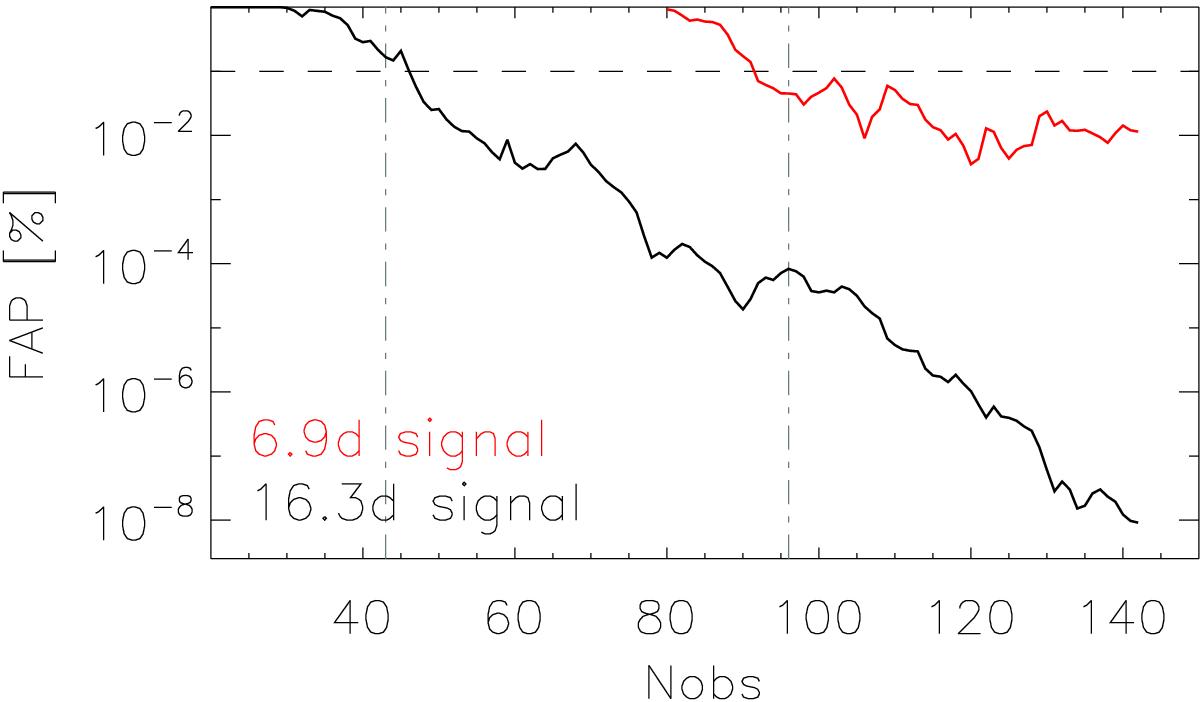
FAP development for the 16.3-day (black) and the 6.9-day (red) signals of the RV data using an increasing number of data points. The dashed horizontal line shows the analytical 0.1% FAP level, and the two vertical dash-dotted lines divide the data into the different seasons.
Current usage metrics show cumulative count of Article Views (full-text article views including HTML views, PDF and ePub downloads, according to the available data) and Abstracts Views on Vision4Press platform.
Data correspond to usage on the plateform after 2015. The current usage metrics is available 48-96 hours after online publication and is updated daily on week days.
Initial download of the metrics may take a while.